

| << Chapter < Page | Chapter >> Page > |
Let the transformation be defined by where and Find the image of the triangle in the with vertices and
The triangle and its image are shown in [link] . To understand how the sides of the triangle transform, call the side that joins and side the side that joins and side and the side that joins and side
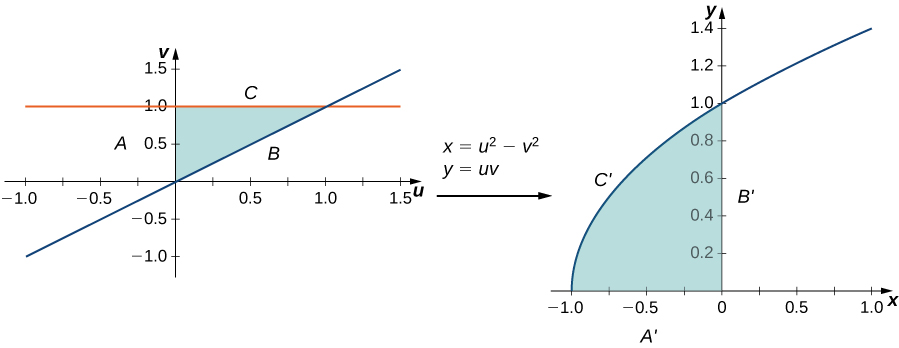
For the side transforms to so this is the side that joins and
For the side transforms to so this is the side that joins and
For the side transforms to (hence so this is the side that makes the upper half of the parabolic arc joining and
All the points in the entire region of the triangle in the are mapped inside the parabolic region in the
Let a transformation be defined as where Find the image of the rectangle from the after the transformation into a region in the Show that is a one-to-one transformation and find
where and
Recall that we mentioned near the beginning of this section that each of the component functions must have continuous first partial derivatives, which means that and exist and are also continuous. A transformation that has this property is called a transformation (here denotes continuous). Let where and be a one-to-one transformation. We want to see how it transforms a small rectangular region units by units, in the (see the following figure).
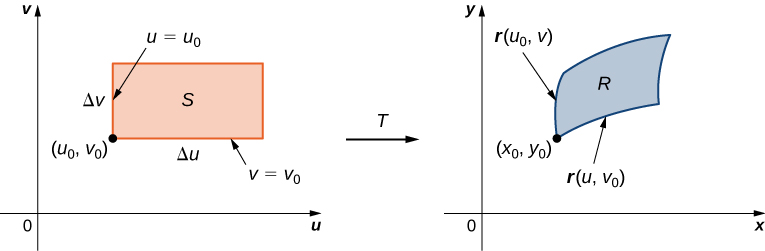
Since and we have the position vector of the image of the point Suppose that is the coordinate of the point at the lower left corner that mapped to The line maps to the image curve with vector function and the tangent vector at to the image curve is
Similarly, the line maps to the image curve with vector function and the tangent vector at to the image curve is
Now, note that
Similarly,
This allows us to estimate the area of the image by finding the area of the parallelogram formed by the sides and By using the cross product of these two vectors by adding the k th component as the area of the image (refer to The Cross Product ) is approximately In determinant form, the cross product is
Since we have
The Jacobian of the transformation is denoted by and is defined by the determinant
Notification Switch
Would you like to follow the 'Calculus volume 3' conversation and receive update notifications?

|
|

|
|
|
|
|

|
|

|
|

|
|

|
|

|
|

|
|

|