| << Chapter < Page | Chapter >> Page > |
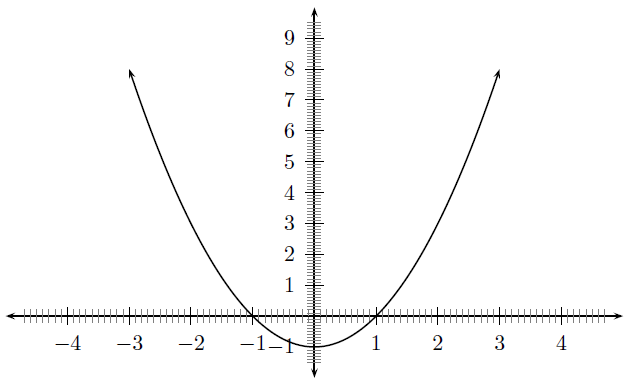
The general shape and position of the graph of the function of the form , called a parabola, is shown in [link] . These are parabolic functions.

The effects of and are a few examples are what are collectively called transformations of the function . The effect of is what is called a translation because all points are moved the same distance in the same direction, specifically a vertical translation (because it slides the graph up and down) of by (note that a horizontal translation by would look like ). The effect of is what is called scaling . When , it is usually called a stretch because the effect on the graph is to stretch it apart, and when (but greater than zero), it is often called a shrink because it makes the graph shrink in on itself. When , it is called a reflection , specifically a reflection about the -axis because the -axis acts as a mirror for the graph. If is some other negative number, one would refer to it as a scaled reflection (or, alternatively, a 'stretched' or 'shrunk' reflection), because it is reflected and scaled. One often refers to reflections, translations, scaling, etc., as the effect of the transformation on the given function.
A more in-depth look at transformations can be found here . This section on transformations is simply an extension and is not needed for examinations.
Complete the following table of values for the functions to to help with drawing the required graphs in this activity:
This simulation allows you to visualise the effect of changing a and q. Note that in this simulation q = c. Also an extra term bx has been added in. You can leave bx as 0, or you can also see what effect this has on the graph.
Phet simulation for graphing
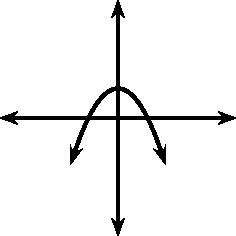
From your graphs, you should have found that affects whether the graph makes a smile or a frown. If , the graph makes a frown and if then the graph makes a smile. This is shown in [link] .

You should have also found that the value of affects whether the turning point is to the left of the -axis ( ) or to the right of the -axis ( ).
These different properties are summarised in [link] .
 |
 | |
 |
 |
For , the domain is because there is no value of for which is undefined.
The range of depends on whether the value for is positive or negative. We will consider these two cases separately.
If then we have:

Notification Switch
Would you like to follow the 'Siyavula textbooks: grade 10 maths [caps]' conversation and receive update notifications?