<< Chapter < Page Chapter >> Page >
This module reviews the basic concepts needed to estimate and understand logit and probit regressions using Stata. It is intended for advanced undergraduates.

Logit and probit models

Introduction

Consider a model that “explains” whether a wife enters the work force. It is straight forward to think of potential explanatory variables—her potential wage rate, the income of her partner, the number of children under the age of 6 in the household, and the number of children in the household between the ages of 6 and 18 are candidates to be independent variables used to explain the wife’s decision to enter the labor force. The dependent variable, Y , however, is a dummy variable because the wife chooses either to enter the labor force ( Y = 1 ) MathType@MTEF@5@5@+=feaagyart1ev2aaatCvAUfeBSjuyZL2yd9gzLbvyNv2CaerbuLwBLnhiov2DGi1BTfMBaeXatLxBI9gBaerbd9wDYLwzYbItLDharqqtubsr4rNCHbGeaGqiVCI8FfYJH8YrFfeuY=Hhbbf9v8qqaqFr0xc9pk0xbba9q8WqFfeaY=biLkVcLq=JHqpepeea0=as0Fb9pgeaYRXxe9vr0=vr0=vqpWqaaeaabiGaciaacaqabeaadaqaaqaaaOqaamaabmaabaGaamywaiabg2da9iaaigdaaiaawIcacaGLPaaaaaa@3A10@ or not to enter the labor force ( Y = 0 ) . MathType@MTEF@5@5@+=feaagyart1ev2aaatCvAUfeBSjuyZL2yd9gzLbvyNv2CaerbuLwBLnhiov2DGi1BTfMBaeXatLxBI9gBaerbd9wDYLwzYbItLDharqqtubsr4rNCHbGeaGqiVCI8FfYJH8YrFfeuY=Hhbbf9v8qqaqFr0xc9pk0xbba9q8WqFfeaY=biLkVcLq=JHqpepeea0=as0Fb9pgeaYRXxe9vr0=vr0=vqpWqaaeaabiGaciaacaqabeaadaqaaqaaaOqaamaabmaabaGaamywaiabg2da9iaaicdaaiaawIcacaGLPaaacaGGUaaaaa@3AC1@ An OLS model of the form:

Y i = β 0 + β 1 x i + ε i MathType@MTEF@5@5@+=feaagyart1ev2aaatCvAUfeBSjuyZL2yd9gzLbvyNv2CaerbuLwBLnhiov2DGi1BTfMBaeXatLxBI9gBaerbd9wDYLwzYbItLDharqqtubsr4rNCHbGeaGqiVCI8FfYJH8YrFfeuY=Hhbbf9v8qqaqFr0xc9pk0xbba9q8WqFfeaY=biLkVcLq=JHqpepeea0=as0Fb9pgeaYRXxe9vr0=vr0=vqpWqaaeaabiGaciaacaqabeaadaqaaqaaaOqaaiaadMfadaWgaaWcbaGaamyAaaqabaGccqGH9aqpcqaHYoGydaWgaaWcbaGaaGimaaqabaGccqGHRaWkcqaHYoGydaWgaaWcbaGaaGymaaqabaGccaWG4bWaaSbaaSqaaiaadMgaaeqaaOGaey4kaSIaeqyTdu2aaSbaaSqaaiaadMgaaeqaaaaa@44B9@

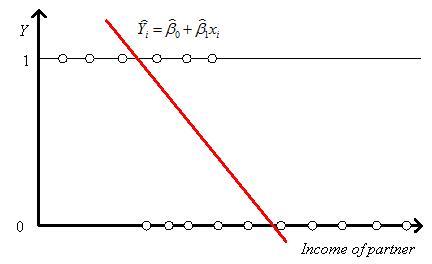
does not make sense. Figure 1 shows what the data of this model might look like when graphed against one of the explanatory variables. Figure 1 also includes the regression line that an OLS estimation of (1) will yield. It is easy to see one problem with this approach—the predicted values of Y that can be greater than 1 and less than 0. In addition, special properties must be attributed to the error term and it is the simple properties ascribed to the error term that make the OLS model so attractive. J. S. Cramer (2003) Logit Models from Economics and Other Fields (Cambridge: Cambridge University Press): 10.

Linear regression line for a discrete dependent variable

Linear representation of a discrete dependent variable
The linear regression line can be a poor representation of a discrete dependent variable.

The logit model

There does exist another approach to the modeling problem—assume that the dependent variable is the probability that the wife is in the labor force . For instance we might assume that we have a linear probability model of the form Pr ( x i ) = β 0 + β 1 x i + ε i . MathType@MTEF@5@5@+=feaagyart1ev2aaatCvAUfeBSjuyZL2yd9gzLbvyNv2CaerbuLwBLnhiov2DGi1BTfMBaeXatLxBI9gBaerbd9wDYLwzYbItLDharqqtubsr4rNCHbGeaGqiVu0Je9sqqrpepC0xbbL8F4rqqrFfpeea0xe9Lq=Jc9vqaqpepm0xbba9pwe9Q8fs0=yqaqpepae9pg0FirpepeKkFr0xfr=xfr=xb9adbaqaaeGaciGaaiaabeqaamaabaabaaGcbaGaciiuaiaackhadaqadaqaaiaadIhadaWgaaWcbaGaamyAaaqabaaakiaawIcacaGLPaaacqGH9aqpcqaHYoGydaWgaaWcbaGaaGimaaqabaGccqGHRaWkcqaHYoGydaWgaaWcbaGaaGymaaqabaGccaWG4bWaaSbaaSqaaiaadMgaaeqaaOGaey4kaSIaeqyTdu2aaSbaaSqaaiaadMgaaeqaaOGaaiOlaaaa@48F4@ This model can be estimated reasonably successfully if the observed frequencies are well away from their bounds of 0 and 1. For a full discussion of this model see Ladd, G. W. (1966) “Linear Probability Functions and Discriminant Functions,”
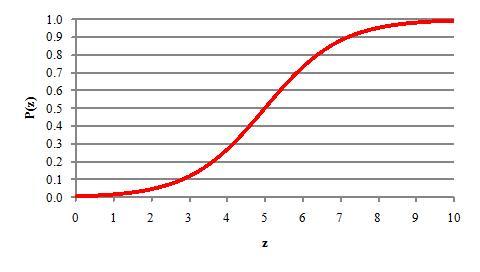
 Econometrica 34 : 873-888. However, is more appealing to assume that the probability varies monotonically with x and remains within the bounds of [0,1], as shown in Figure 2. This S-shaped curve is known as the sigmoid curve and can be represented algebraically for some variable z by: Pr ( z ) = e z 1 + e z . MathType@MTEF@5@5@+=feaagyart1ev2aaatCvAUfeBSjuyZL2yd9gzLbvyNv2CaerbuLwBLnhiov2DGi1BTfMBaeXatLxBI9gBaerbd9wDYLwzYbItLDharqqtubsr4rNCHbGeaGqiVu0Je9sqqrpepC0xbbL8F4rqqrFfpeea0xe9Lq=Jc9vqaqpepm0xbba9pwe9Q8fs0=yqaqpepae9pg0FirpepeKkFr0xfr=xfr=xb9adbaqaaeGaciGaaiaabeqaamaabaabaaGcbaGaciiuaiaackhadaqadaqaaiaadQhaaiaawIcacaGLPaaacqGH9aqpdaWcaaqaaiaadwgadaahaaWcbeqaaiaadQhaaaaakeaacaaIXaGaey4kaSIaamyzamaaCaaaleqabaGaamOEaaaaaaGccaGGUaaaaa@41EC@

The signoid function.

The S-shaped graphical representation of a signoid function.
The signoid function forces the dependent variable to be between 0 and 1.

We can simplify our analysis by using a bit of algebra. First, the inverse probability is 1 Pr ( z ) = 1 e z 1 + e z = 1 1 + e z . MathType@MTEF@5@5@+=feaagyart1ev2aaatCvAUfeBSjuyZL2yd9gzLbvyNv2CaerbuLwBLnhiov2DGi1BTfMBaeXatLxBI9gBaerbd9wDYLwzYbItLDharqqtubsr4rNCHbGeaGqiVu0Je9sqqrpepC0xbbL8F4rqqrFfpeea0xe9Lq=Jc9vqaqpepm0xbba9pwe9Q8fs0=yqaqpepae9pg0FirpepeKkFr0xfr=xfr=xb9adbaqaaeGaciGaaiaabeqaamaabaabaaGcbaGaaGymaiabgkHiTiGaccfacaGGYbWaaeWaaeaacaWG6baacaGLOaGaayzkaaGaeyypa0JaaGymaiabgkHiTmaalaaabaGaamyzamaaCaaaleqabaGaamOEaaaaaOqaaiaaigdacqGHRaWkcaWGLbWaaWbaaSqabeaacaWG6baaaaaakiabg2da9maalaaabaGaaGymaaqaaiaaigdacqGHRaWkcaWGLbWaaWbaaSqabeaacaWG6baaaaaakiaac6caaaa@4ACA@ Thus,

Pr ( z ) 1 Pr ( z ) = e z 1 + e z 1 1 + e z = e z . MathType@MTEF@5@5@+=feaagyart1ev2aaatCvAUfeBSjuyZL2yd9gzLbvyNv2CaerbuLwBLnhiov2DGi1BTfMBaeXatLxBI9gBaerbd9wDYLwzYbItLDharqqtubsr4rNCHbGeaGqiVu0Je9sqqrpepC0xbbL8F4rqqrFfpeea0xe9Lq=Jc9vqaqpepm0xbba9pwe9Q8fs0=yqaqpepae9pg0FirpepeKkFr0xfr=xfr=xb9adbaqaaeGaciGaaiaabeqaamaabaabaaGcbaWaaSaaaeaaciGGqbGaaiOCamaabmaabaGaamOEaaGaayjkaiaawMcaaaqaaiaaigdacqGHsislciGGqbGaaiOCamaabmaabaGaamOEaaGaayjkaiaawMcaaaaacqGH9aqpdaWcaaqaamaalaaabaGaamyzamaaCaaaleqabaGaamOEaaaaaOqaaiaaigdacqGHRaWkcaWGLbWaaWbaaSqabeaacaWG6baaaaaaaOqaamaalaaabaGaaGymaaqaaiaaigdacqGHRaWkcaWGLbWaaWbaaSqabeaacaWG6baaaaaaaaGccqGH9aqpcaWGLbWaaWbaaSqabeaacaWG6baaaOGaaiOlaaaa@4FB6@

Taking the natural logarithm of (2) gives ln ( Pr ( z ) 1 Pr ( z ) ) = z . MathType@MTEF@5@5@+=feaagyart1ev2aaatCvAUfeBSjuyZL2yd9gzLbvyNv2CaerbuLwBLnhiov2DGi1BTfMBaeXatLxBI9gBaerbd9wDYLwzYbItLDharqqtubsr4rNCHbGeaGqiVu0Je9sqqrpepC0xbbL8F4rqqrFfpeea0xe9Lq=Jc9vqaqpepm0xbba9pwe9Q8fs0=yqaqpepae9pg0FirpepeKkFr0xfr=xfr=xb9adbaqaaeGaciGaaiaabeqaamaabaabaaGcbaGaciiBaiaac6gadaqadaqaamaalaaabaGaciiuaiaackhadaqadaqaaiaadQhaaiaawIcacaGLPaaaaeaacaaIXaGaeyOeI0IaciiuaiaackhadaqadaqaaiaadQhaaiaawIcacaGLPaaaaaaacaGLOaGaayzkaaGaeyypa0JaamOEaiaac6caaaa@4677@ Assuming that z is a linear function of x (and, more generally, of other variables) gives the logit model:

ln ( Pr ( x i ) 1 Pr ( x i ) ) = β 0 + β 1 x i + ε i . MathType@MTEF@5@5@+=feaagyart1ev2aaatCvAUfeBSjuyZL2yd9gzLbvyNv2CaerbuLwBLnhiov2DGi1BTfMBaeXatLxBI9gBaerbd9wDYLwzYbItLDharqqtubsr4rNCHbGeaGqiVu0Je9sqqrpepC0xbbL8F4rqqrFfpeea0xe9Lq=Jc9vqaqpepm0xbba9pwe9Q8fs0=yqaqpepae9pg0FirpepeKkFr0xfr=xfr=xb9adbaqaaeGaciGaaiaabeqaamaabaabaaGcbaGaciiBaiaac6gadaqadaqaamaalaaabaGaciiuaiaackhadaqadaqaaiaadIhadaWgaaWcbaGaamyAaaqabaaakiaawIcacaGLPaaaaeaacaaIXaGaeyOeI0IaciiuaiaackhadaqadaqaaiaadIhadaWgaaWcbaGaamyAaaqabaaakiaawIcacaGLPaaaaaaacaGLOaGaayzkaaGaeyypa0JaeqOSdi2aaSbaaSqaaiaaicdaaeqaaOGaey4kaSIaeqOSdi2aaSbaaSqaaiaaigdaaeqaaOGaamiEamaaBaaaleaacaWGPbaabeaakiabgUcaRiabew7aLnaaBaaaleaacaWGPbaabeaaaaa@52D3@

We can estimate the parameters of this model using maximum likelihood methods . In the probit model the error term is assumed to be normally distributed with a mean of zero and a unit variance. The assumption that the variance is equal to 1 is due to technical considerations. See [Cramer, 22]. In the logit model the error term is assumed to have a standardized logistic distribution . This distribution has a mean of 0 and a variance of 1 and is very similar to a normal distribution with the same mean and variance. The pdf of a logistic distribution is f ( x ) = λ e λ x ( 1 + e λ x ) 2 MathType@MTEF@5@5@+=feaagyart1ev2aaatCvAUfeBSjuyZL2yd9gzLbvyNv2CaerbuLwBLnhiov2DGi1BTfMBaeXatLxBI9gBaerbd9wDYLwzYbItLDharqqtubsr4rNCHbGeaGqiVu0Je9sqqrpepC0xbbL8F4rqqrFfpeea0xe9Lq=Jc9vqaqpepm0xbba9pwe9Q8fs0=yqaqpepae9pg0FirpepeKkFr0xfr=xfr=xb9adbaqaaeGaciGaaiaabeqaamaabaabaaGcbaaeaaaaaaaaa8qacaWGMbGaaiikaiaadIhacaGGPaGaeyypa0ZaaSaaa8aabaWdbiabeU7aSjaadwgapaWaaWbaaSqabeaapeGaeyOeI0Iaeq4UdWMaamiEaaaaaOWdaeaapeWaaeWaa8aabaWdbiaaigdacqGHRaWkcaWGLbWdamaaCaaaleqabaWdbiabgkHiTiabeU7aSjaadIhaaaaakiaawIcacaGLPaaapaWaaWbaaSqabeaapeGaaGOmaaaaaaaaaa@4A65@ , where λ = π 3 1.814 MathType@MTEF@5@5@+=feaagyart1ev2aqatCvAUfeBSjuyZL2yd9gzLbvyNv2CaerbuLwBLnhiov2DGi1BTfMBaeXatLxBI9gBaerbd9wDYLwzYbItLDharqqtubsr4rNCHbGeaGqiVu0Je9sqqrpepC0xbbL8F4rqqrFfpeea0xe9Lq=Jc9vqaqpepm0xbba9pwe9Q8fs0=yqaqpepae9pg0FirpepeKkFr0xfr=xfr=xb9adbaqaaeGaciGaaiaabeqaamaabaabaaGcbaGaeq4UdWMaeyypa0ZaaSaaaeaacqaHapaCaeaadaGcaaqaaiaaiodaaSqabaaaaOGaeyisISRaaGymaiaac6cacaaI4aGaaGymaiaaisdaaaa@40B6@ . See Cramer, 24-26 for a fuller discussion of the logistic distribution. While the choice of which model to use generally is personal, it should be noted that the ratio of the parameter of a logit model to the parameter of a probit model (using the same data set) usually varies between 1.6 and 2.0. We focus on the logit model in the balance of this discussion.

Questions & Answers

how does Neisseria cause meningitis
Nyibol Reply
what is microbiologist
Muhammad Reply
what is errata
Muhammad
is the branch of biology that deals with the study of microorganisms.
Ntefuni Reply
What is microbiology
Mercy Reply
studies of microbes
Louisiaste
when we takee the specimen which lumbar,spin,
Ziyad Reply
How bacteria create energy to survive?
Muhamad Reply
Bacteria doesn't produce energy they are dependent upon their substrate in case of lack of nutrients they are able to make spores which helps them to sustain in harsh environments
_Adnan
But not all bacteria make spores, l mean Eukaryotic cells have Mitochondria which acts as powerhouse for them, since bacteria don't have it, what is the substitution for it?
Muhamad
they make spores
Louisiaste
what is sporadic nd endemic, epidemic
Aminu Reply
the significance of food webs for disease transmission
Abreham
food webs brings about an infection as an individual depends on number of diseased foods or carriers dully.
Mark
explain assimilatory nitrate reduction
Esinniobiwa Reply
Assimilatory nitrate reduction is a process that occurs in some microorganisms, such as bacteria and archaea, in which nitrate (NO3-) is reduced to nitrite (NO2-), and then further reduced to ammonia (NH3).
Elkana
This process is called assimilatory nitrate reduction because the nitrogen that is produced is incorporated in the cells of microorganisms where it can be used in the synthesis of amino acids and other nitrogen products
Elkana
Examples of thermophilic organisms
Shu Reply
Give Examples of thermophilic organisms
Shu
advantages of normal Flora to the host
Micheal Reply
Prevent foreign microbes to the host
Abubakar
they provide healthier benefits to their hosts
ayesha
They are friends to host only when Host immune system is strong and become enemies when the host immune system is weakened . very bad relationship!
Mark
what is cell
faisal Reply
cell is the smallest unit of life
Fauziya
cell is the smallest unit of life
Akanni
ok
Innocent
cell is the structural and functional unit of life
Hasan
is the fundamental units of Life
Musa
what are emergency diseases
Micheal Reply
There are nothing like emergency disease but there are some common medical emergency which can occur simultaneously like Bleeding,heart attack,Breathing difficulties,severe pain heart stock.Hope you will get my point .Have a nice day ❣️
_Adnan
define infection ,prevention and control
Innocent
I think infection prevention and control is the avoidance of all things we do that gives out break of infections and promotion of health practices that promote life
Lubega
Heyy Lubega hussein where are u from?
_Adnan
en français
Adama
which site have a normal flora
ESTHER Reply
Many sites of the body have it Skin Nasal cavity Oral cavity Gastro intestinal tract
Safaa
skin
Asiina
skin,Oral,Nasal,GIt
Sadik
How can Commensal can Bacteria change into pathogen?
Sadik
How can Commensal Bacteria change into pathogen?
Sadik
all
Tesfaye
by fussion
Asiina
what are the advantages of normal Flora to the host
Micheal
what are the ways of control and prevention of nosocomial infection in the hospital
Micheal
what is inflammation
Shelly Reply
part of a tissue or an organ being wounded or bruised.
Wilfred
what term is used to name and classify microorganisms?
Micheal Reply
Binomial nomenclature
adeolu
Got questions? Join the online conversation and get instant answers!
Jobilize.com Reply

Get Jobilize Job Search Mobile App in your pocket Now!

Get it on Google Play Download on the App Store Now


Source:  OpenStax, Econometrics for honors students. OpenStax CNX. Jul 20, 2010 Download for free at http://cnx.org/content/col11208/1.2
Google Play and the Google Play logo are trademarks of Google Inc.

Notification Switch

Would you like to follow the 'Econometrics for honors students' conversation and receive update notifications?

Ask