<< Chapter < Page Chapter >> Page >
This module reviews the basic concepts needed to estimate and understand logit and probit regressions using Stata. It is intended for advanced undergraduates.

Logit and probit models

Introduction

Consider a model that “explains” whether a wife enters the work force. It is straight forward to think of potential explanatory variables—her potential wage rate, the income of her partner, the number of children under the age of 6 in the household, and the number of children in the household between the ages of 6 and 18 are candidates to be independent variables used to explain the wife’s decision to enter the labor force. The dependent variable, Y , however, is a dummy variable because the wife chooses either to enter the labor force ( Y = 1 ) MathType@MTEF@5@5@+=feaagyart1ev2aaatCvAUfeBSjuyZL2yd9gzLbvyNv2CaerbuLwBLnhiov2DGi1BTfMBaeXatLxBI9gBaerbd9wDYLwzYbItLDharqqtubsr4rNCHbGeaGqiVCI8FfYJH8YrFfeuY=Hhbbf9v8qqaqFr0xc9pk0xbba9q8WqFfeaY=biLkVcLq=JHqpepeea0=as0Fb9pgeaYRXxe9vr0=vr0=vqpWqaaeaabiGaciaacaqabeaadaqaaqaaaOqaamaabmaabaGaamywaiabg2da9iaaigdaaiaawIcacaGLPaaaaaa@3A10@ or not to enter the labor force ( Y = 0 ) . MathType@MTEF@5@5@+=feaagyart1ev2aaatCvAUfeBSjuyZL2yd9gzLbvyNv2CaerbuLwBLnhiov2DGi1BTfMBaeXatLxBI9gBaerbd9wDYLwzYbItLDharqqtubsr4rNCHbGeaGqiVCI8FfYJH8YrFfeuY=Hhbbf9v8qqaqFr0xc9pk0xbba9q8WqFfeaY=biLkVcLq=JHqpepeea0=as0Fb9pgeaYRXxe9vr0=vr0=vqpWqaaeaabiGaciaacaqabeaadaqaaqaaaOqaamaabmaabaGaamywaiabg2da9iaaicdaaiaawIcacaGLPaaacaGGUaaaaa@3AC1@ An OLS model of the form:

Y i = β 0 + β 1 x i + ε i MathType@MTEF@5@5@+=feaagyart1ev2aaatCvAUfeBSjuyZL2yd9gzLbvyNv2CaerbuLwBLnhiov2DGi1BTfMBaeXatLxBI9gBaerbd9wDYLwzYbItLDharqqtubsr4rNCHbGeaGqiVCI8FfYJH8YrFfeuY=Hhbbf9v8qqaqFr0xc9pk0xbba9q8WqFfeaY=biLkVcLq=JHqpepeea0=as0Fb9pgeaYRXxe9vr0=vr0=vqpWqaaeaabiGaciaacaqabeaadaqaaqaaaOqaaiaadMfadaWgaaWcbaGaamyAaaqabaGccqGH9aqpcqaHYoGydaWgaaWcbaGaaGimaaqabaGccqGHRaWkcqaHYoGydaWgaaWcbaGaaGymaaqabaGccaWG4bWaaSbaaSqaaiaadMgaaeqaaOGaey4kaSIaeqyTdu2aaSbaaSqaaiaadMgaaeqaaaaa@44B9@

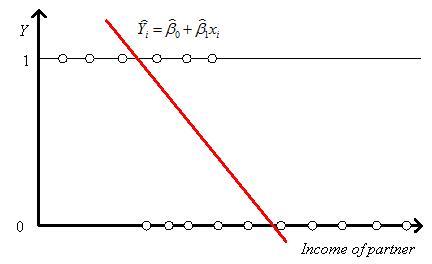
does not make sense. Figure 1 shows what the data of this model might look like when graphed against one of the explanatory variables. Figure 1 also includes the regression line that an OLS estimation of (1) will yield. It is easy to see one problem with this approach—the predicted values of Y that can be greater than 1 and less than 0. In addition, special properties must be attributed to the error term and it is the simple properties ascribed to the error term that make the OLS model so attractive. J. S. Cramer (2003) Logit Models from Economics and Other Fields (Cambridge: Cambridge University Press): 10.

Linear regression line for a discrete dependent variable

Linear representation of a discrete dependent variable
The linear regression line can be a poor representation of a discrete dependent variable.

The logit model

There does exist another approach to the modeling problem—assume that the dependent variable is the probability that the wife is in the labor force . For instance we might assume that we have a linear probability model of the form Pr ( x i ) = β 0 + β 1 x i + ε i . MathType@MTEF@5@5@+=feaagyart1ev2aaatCvAUfeBSjuyZL2yd9gzLbvyNv2CaerbuLwBLnhiov2DGi1BTfMBaeXatLxBI9gBaerbd9wDYLwzYbItLDharqqtubsr4rNCHbGeaGqiVu0Je9sqqrpepC0xbbL8F4rqqrFfpeea0xe9Lq=Jc9vqaqpepm0xbba9pwe9Q8fs0=yqaqpepae9pg0FirpepeKkFr0xfr=xfr=xb9adbaqaaeGaciGaaiaabeqaamaabaabaaGcbaGaciiuaiaackhadaqadaqaaiaadIhadaWgaaWcbaGaamyAaaqabaaakiaawIcacaGLPaaacqGH9aqpcqaHYoGydaWgaaWcbaGaaGimaaqabaGccqGHRaWkcqaHYoGydaWgaaWcbaGaaGymaaqabaGccaWG4bWaaSbaaSqaaiaadMgaaeqaaOGaey4kaSIaeqyTdu2aaSbaaSqaaiaadMgaaeqaaOGaaiOlaaaa@48F4@ This model can be estimated reasonably successfully if the observed frequencies are well away from their bounds of 0 and 1. For a full discussion of this model see Ladd, G. W. (1966) “Linear Probability Functions and Discriminant Functions,”
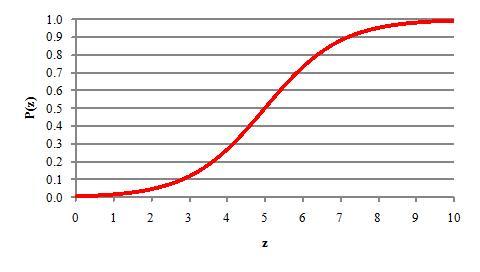
 Econometrica 34 : 873-888. However, is more appealing to assume that the probability varies monotonically with x and remains within the bounds of [0,1], as shown in Figure 2. This S-shaped curve is known as the sigmoid curve and can be represented algebraically for some variable z by: Pr ( z ) = e z 1 + e z . MathType@MTEF@5@5@+=feaagyart1ev2aaatCvAUfeBSjuyZL2yd9gzLbvyNv2CaerbuLwBLnhiov2DGi1BTfMBaeXatLxBI9gBaerbd9wDYLwzYbItLDharqqtubsr4rNCHbGeaGqiVu0Je9sqqrpepC0xbbL8F4rqqrFfpeea0xe9Lq=Jc9vqaqpepm0xbba9pwe9Q8fs0=yqaqpepae9pg0FirpepeKkFr0xfr=xfr=xb9adbaqaaeGaciGaaiaabeqaamaabaabaaGcbaGaciiuaiaackhadaqadaqaaiaadQhaaiaawIcacaGLPaaacqGH9aqpdaWcaaqaaiaadwgadaahaaWcbeqaaiaadQhaaaaakeaacaaIXaGaey4kaSIaamyzamaaCaaaleqabaGaamOEaaaaaaGccaGGUaaaaa@41EC@

The signoid function.

The S-shaped graphical representation of a signoid function.
The signoid function forces the dependent variable to be between 0 and 1.

We can simplify our analysis by using a bit of algebra. First, the inverse probability is 1 Pr ( z ) = 1 e z 1 + e z = 1 1 + e z . MathType@MTEF@5@5@+=feaagyart1ev2aaatCvAUfeBSjuyZL2yd9gzLbvyNv2CaerbuLwBLnhiov2DGi1BTfMBaeXatLxBI9gBaerbd9wDYLwzYbItLDharqqtubsr4rNCHbGeaGqiVu0Je9sqqrpepC0xbbL8F4rqqrFfpeea0xe9Lq=Jc9vqaqpepm0xbba9pwe9Q8fs0=yqaqpepae9pg0FirpepeKkFr0xfr=xfr=xb9adbaqaaeGaciGaaiaabeqaamaabaabaaGcbaGaaGymaiabgkHiTiGaccfacaGGYbWaaeWaaeaacaWG6baacaGLOaGaayzkaaGaeyypa0JaaGymaiabgkHiTmaalaaabaGaamyzamaaCaaaleqabaGaamOEaaaaaOqaaiaaigdacqGHRaWkcaWGLbWaaWbaaSqabeaacaWG6baaaaaakiabg2da9maalaaabaGaaGymaaqaaiaaigdacqGHRaWkcaWGLbWaaWbaaSqabeaacaWG6baaaaaakiaac6caaaa@4ACA@ Thus,

Pr ( z ) 1 Pr ( z ) = e z 1 + e z 1 1 + e z = e z . MathType@MTEF@5@5@+=feaagyart1ev2aaatCvAUfeBSjuyZL2yd9gzLbvyNv2CaerbuLwBLnhiov2DGi1BTfMBaeXatLxBI9gBaerbd9wDYLwzYbItLDharqqtubsr4rNCHbGeaGqiVu0Je9sqqrpepC0xbbL8F4rqqrFfpeea0xe9Lq=Jc9vqaqpepm0xbba9pwe9Q8fs0=yqaqpepae9pg0FirpepeKkFr0xfr=xfr=xb9adbaqaaeGaciGaaiaabeqaamaabaabaaGcbaWaaSaaaeaaciGGqbGaaiOCamaabmaabaGaamOEaaGaayjkaiaawMcaaaqaaiaaigdacqGHsislciGGqbGaaiOCamaabmaabaGaamOEaaGaayjkaiaawMcaaaaacqGH9aqpdaWcaaqaamaalaaabaGaamyzamaaCaaaleqabaGaamOEaaaaaOqaaiaaigdacqGHRaWkcaWGLbWaaWbaaSqabeaacaWG6baaaaaaaOqaamaalaaabaGaaGymaaqaaiaaigdacqGHRaWkcaWGLbWaaWbaaSqabeaacaWG6baaaaaaaaGccqGH9aqpcaWGLbWaaWbaaSqabeaacaWG6baaaOGaaiOlaaaa@4FB6@

Taking the natural logarithm of (2) gives ln ( Pr ( z ) 1 Pr ( z ) ) = z . MathType@MTEF@5@5@+=feaagyart1ev2aaatCvAUfeBSjuyZL2yd9gzLbvyNv2CaerbuLwBLnhiov2DGi1BTfMBaeXatLxBI9gBaerbd9wDYLwzYbItLDharqqtubsr4rNCHbGeaGqiVu0Je9sqqrpepC0xbbL8F4rqqrFfpeea0xe9Lq=Jc9vqaqpepm0xbba9pwe9Q8fs0=yqaqpepae9pg0FirpepeKkFr0xfr=xfr=xb9adbaqaaeGaciGaaiaabeqaamaabaabaaGcbaGaciiBaiaac6gadaqadaqaamaalaaabaGaciiuaiaackhadaqadaqaaiaadQhaaiaawIcacaGLPaaaaeaacaaIXaGaeyOeI0IaciiuaiaackhadaqadaqaaiaadQhaaiaawIcacaGLPaaaaaaacaGLOaGaayzkaaGaeyypa0JaamOEaiaac6caaaa@4677@ Assuming that z is a linear function of x (and, more generally, of other variables) gives the logit model:

ln ( Pr ( x i ) 1 Pr ( x i ) ) = β 0 + β 1 x i + ε i . MathType@MTEF@5@5@+=feaagyart1ev2aaatCvAUfeBSjuyZL2yd9gzLbvyNv2CaerbuLwBLnhiov2DGi1BTfMBaeXatLxBI9gBaerbd9wDYLwzYbItLDharqqtubsr4rNCHbGeaGqiVu0Je9sqqrpepC0xbbL8F4rqqrFfpeea0xe9Lq=Jc9vqaqpepm0xbba9pwe9Q8fs0=yqaqpepae9pg0FirpepeKkFr0xfr=xfr=xb9adbaqaaeGaciGaaiaabeqaamaabaabaaGcbaGaciiBaiaac6gadaqadaqaamaalaaabaGaciiuaiaackhadaqadaqaaiaadIhadaWgaaWcbaGaamyAaaqabaaakiaawIcacaGLPaaaaeaacaaIXaGaeyOeI0IaciiuaiaackhadaqadaqaaiaadIhadaWgaaWcbaGaamyAaaqabaaakiaawIcacaGLPaaaaaaacaGLOaGaayzkaaGaeyypa0JaeqOSdi2aaSbaaSqaaiaaicdaaeqaaOGaey4kaSIaeqOSdi2aaSbaaSqaaiaaigdaaeqaaOGaamiEamaaBaaaleaacaWGPbaabeaakiabgUcaRiabew7aLnaaBaaaleaacaWGPbaabeaaaaa@52D3@

We can estimate the parameters of this model using maximum likelihood methods . In the probit model the error term is assumed to be normally distributed with a mean of zero and a unit variance. The assumption that the variance is equal to 1 is due to technical considerations. See [Cramer, 22]. In the logit model the error term is assumed to have a standardized logistic distribution . This distribution has a mean of 0 and a variance of 1 and is very similar to a normal distribution with the same mean and variance. The pdf of a logistic distribution is f ( x ) = λ e λ x ( 1 + e λ x ) 2 MathType@MTEF@5@5@+=feaagyart1ev2aaatCvAUfeBSjuyZL2yd9gzLbvyNv2CaerbuLwBLnhiov2DGi1BTfMBaeXatLxBI9gBaerbd9wDYLwzYbItLDharqqtubsr4rNCHbGeaGqiVu0Je9sqqrpepC0xbbL8F4rqqrFfpeea0xe9Lq=Jc9vqaqpepm0xbba9pwe9Q8fs0=yqaqpepae9pg0FirpepeKkFr0xfr=xfr=xb9adbaqaaeGaciGaaiaabeqaamaabaabaaGcbaaeaaaaaaaaa8qacaWGMbGaaiikaiaadIhacaGGPaGaeyypa0ZaaSaaa8aabaWdbiabeU7aSjaadwgapaWaaWbaaSqabeaapeGaeyOeI0Iaeq4UdWMaamiEaaaaaOWdaeaapeWaaeWaa8aabaWdbiaaigdacqGHRaWkcaWGLbWdamaaCaaaleqabaWdbiabgkHiTiabeU7aSjaadIhaaaaakiaawIcacaGLPaaapaWaaWbaaSqabeaapeGaaGOmaaaaaaaaaa@4A65@ , where λ = π 3 1.814 MathType@MTEF@5@5@+=feaagyart1ev2aqatCvAUfeBSjuyZL2yd9gzLbvyNv2CaerbuLwBLnhiov2DGi1BTfMBaeXatLxBI9gBaerbd9wDYLwzYbItLDharqqtubsr4rNCHbGeaGqiVu0Je9sqqrpepC0xbbL8F4rqqrFfpeea0xe9Lq=Jc9vqaqpepm0xbba9pwe9Q8fs0=yqaqpepae9pg0FirpepeKkFr0xfr=xfr=xb9adbaqaaeGaciGaaiaabeqaamaabaabaaGcbaGaeq4UdWMaeyypa0ZaaSaaaeaacqaHapaCaeaadaGcaaqaaiaaiodaaSqabaaaaOGaeyisISRaaGymaiaac6cacaaI4aGaaGymaiaaisdaaaa@40B6@ . See Cramer, 24-26 for a fuller discussion of the logistic distribution. While the choice of which model to use generally is personal, it should be noted that the ratio of the parameter of a logit model to the parameter of a probit model (using the same data set) usually varies between 1.6 and 2.0. We focus on the logit model in the balance of this discussion.

Questions & Answers

Discuss the differences between taste and flavor, including how other sensory inputs contribute to our  perception of flavor.
John Reply
taste refers to your understanding of the flavor . while flavor one The other hand is refers to sort of just a blend things.
Faith
While taste primarily relies on our taste buds, flavor involves a complex interplay between taste and aroma
Kamara
which drugs can we use for ulcers
Ummi Reply
omeprazole
Kamara
what
Renee
what is this
Renee
is a drug
Kamara
of anti-ulcer
Kamara
Omeprazole Cimetidine / Tagament For the complicated once ulcer - kit
Patrick
what is the function of lymphatic system
Nency Reply
Not really sure
Eli
to drain extracellular fluid all over the body.
asegid
The lymphatic system plays several crucial roles in the human body, functioning as a key component of the immune system and contributing to the maintenance of fluid balance. Its main functions include: 1. Immune Response: The lymphatic system produces and transports lymphocytes, which are a type of
asegid
to transport fluids fats proteins and lymphocytes to the blood stream as lymph
Adama
what is anatomy
Oyindarmola Reply
Anatomy is the identification and description of the structures of living things
Kamara
what's the difference between anatomy and physiology
Oyerinde Reply
Anatomy is the study of the structure of the body, while physiology is the study of the function of the body. Anatomy looks at the body's organs and systems, while physiology looks at how those organs and systems work together to keep the body functioning.
AI-Robot
what is enzymes all about?
Mohammed Reply
Enzymes are proteins that help speed up chemical reactions in our bodies. Enzymes are essential for digestion, liver function and much more. Too much or too little of a certain enzyme can cause health problems
Kamara
yes
Prince
how does the stomach protect itself from the damaging effects of HCl
Wulku Reply
little girl okay how does the stomach protect itself from the damaging effect of HCL
Wulku
it is because of the enzyme that the stomach produce that help the stomach from the damaging effect of HCL
Kamara
function of digestive system
Ali Reply
function of digestive
Ali
the diagram of the lungs
Adaeze Reply
what is the normal body temperature
Diya Reply
37 degrees selcius
Xolo
37°c
Stephanie
please why 37 degree selcius normal temperature
Mark
36.5
Simon
37°c
Iyogho
the normal temperature is 37°c or 98.6 °Fahrenheit is important for maintaining the homeostasis in the body the body regular this temperature through the process called thermoregulation which involves brain skin muscle and other organ working together to maintain stable internal temperature
Stephanie
37A c
Wulku
what is anaemia
Diya Reply
anaemia is the decrease in RBC count hemoglobin count and PVC count
Eniola
what is the pH of the vagina
Diya Reply
how does Lysin attack pathogens
Diya
acid
Mary
I information on anatomy position and digestive system and there enzyme
Elisha Reply
anatomy of the female external genitalia
Muhammad Reply
Organ Systems Of The Human Body (Continued) Organ Systems Of The Human Body (Continued)
Theophilus Reply
what's lochia albra
Kizito
Got questions? Join the online conversation and get instant answers!
Jobilize.com Reply

Get Jobilize Job Search Mobile App in your pocket Now!

Get it on Google Play Download on the App Store Now


Source:  OpenStax, Econometrics for honors students. OpenStax CNX. Jul 20, 2010 Download for free at http://cnx.org/content/col11208/1.2
Google Play and the Google Play logo are trademarks of Google Inc.

Notification Switch

Would you like to follow the 'Econometrics for honors students' conversation and receive update notifications?

Ask