<< Chapter < Page Chapter >> Page >
Pigs were domesticated from the wild boar over 8,000 years ago and have been shaped by natural and artificial selection. As omnivores with a wide variety of food choices, they are an interesting model for optimal foraging theory. Wild boars often eat grass, nuts, berries, insects, and small mammals, but have also been observed to prey on deer and large wild cats. Domestic pigs in captivity are provided with food, but still exhibit a wide variety of foraging related behaviors, such as chewing, biting, and rooting. These behaviors may sometimes be hunger-motivated, but are also an important way for pigs to explore their environment and learn about potential nutrient sources. Through domestication, pigs have lost the need to forage effectively. However, their behavior still follows the predictions of optimal foraging theory. The differences between domestic pig and wild boar foraging patterns reveal an interesting interplay between artificial and natural selection.

Author: Arielle Layman

Introduction

A pig
A domestic pig, Sus scrofa . Creative Commons-Licensed
<http://www.flickr.com/photos/fleur-design/428341583>

Optimal foraging theory uses theories of natural selection to interpret organisms’ feeding strategies. It predicts that animals that maximize caloric intake while minimizing costs will increase their fitness (Stephens, 2007). When applying the theory to an organism, three factors, which are called assumptions, must be considered:

  1. Decision Assumptions
    1. What is the organism’s goal in foraging? For example, is it looking to maximize nutrient intake or prevent starvation?
  2. Currency Assumptions
    1. How will the organism compare choices?
  3. Constraint Assumptions
    1. What limits does the organism face? For instance, what is available and what is safe to eat? (Stephens, 1986)

The predictions of optimal foraging theory vary greatly depending on the organism studied. An herbivore may have to weigh the risk of being preyed upon while against the nutritional benefit of the food. A carnivore may have to choose between a high-risk high-gain scenario, such as attacking large but difficult to subdue prey, and a low-risk low-gain scenario, such as consuming easy to attack but less substantial prey. Optimal foraging theory can therefore be divided into two main questions: how long should an herbivore stay in a food patch and which prey should a carnivore consume? (Stephens, 1986).

Often, a forager’s decisions are dependent on those of another forager, and social foraging theories apply. For example, a bee may perform a dance to show its hive the location of nectar (Kamil, 1987) or predators may hunt in packs (Giraldeau, 2000)

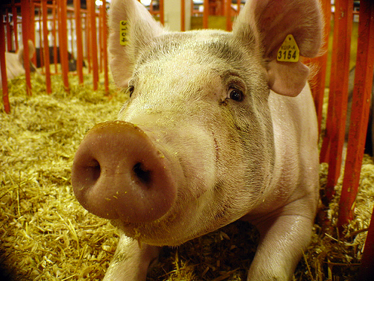
The domestic pig, Sus scrofa domestica , is an interesting organism to study in the light of optimal foraging theory. It is an omnivore that faces few constraints—it is preyed upon by few predators and has a varied diet— so it has many foraging options (Watson, 2004). Comparing its behavior to its undomesticated predecessor, the wild boar ( Sus scrofa ), provides a unique perspective on the evolution of foraging.

Questions & Answers

differentiate between demand and supply giving examples
Lambiv Reply
differentiated between demand and supply using examples
Lambiv
what is labour ?
Lambiv
how will I do?
Venny Reply
how is the graph works?I don't fully understand
Rezat Reply
information
Eliyee
devaluation
Eliyee
t
WARKISA
hi guys good evening to all
Lambiv
multiple choice question
Aster Reply
appreciation
Eliyee
explain perfect market
Lindiwe Reply
In economics, a perfect market refers to a theoretical construct where all participants have perfect information, goods are homogenous, there are no barriers to entry or exit, and prices are determined solely by supply and demand. It's an idealized model used for analysis,
Ezea
What is ceteris paribus?
Shukri Reply
other things being equal
AI-Robot
When MP₁ becomes negative, TP start to decline. Extuples Suppose that the short-run production function of certain cut-flower firm is given by: Q=4KL-0.6K2 - 0.112 • Where is quantity of cut flower produced, I is labour input and K is fixed capital input (K-5). Determine the average product of lab
Kelo
Extuples Suppose that the short-run production function of certain cut-flower firm is given by: Q=4KL-0.6K2 - 0.112 • Where is quantity of cut flower produced, I is labour input and K is fixed capital input (K-5). Determine the average product of labour (APL) and marginal product of labour (MPL)
Kelo
yes,thank you
Shukri
Can I ask you other question?
Shukri
what is monopoly mean?
Habtamu Reply
What is different between quantity demand and demand?
Shukri Reply
Quantity demanded refers to the specific amount of a good or service that consumers are willing and able to purchase at a give price and within a specific time period. Demand, on the other hand, is a broader concept that encompasses the entire relationship between price and quantity demanded
Ezea
ok
Shukri
how do you save a country economic situation when it's falling apart
Lilia Reply
what is the difference between economic growth and development
Fiker Reply
Economic growth as an increase in the production and consumption of goods and services within an economy.but Economic development as a broader concept that encompasses not only economic growth but also social & human well being.
Shukri
production function means
Jabir
What do you think is more important to focus on when considering inequality ?
Abdisa Reply
any question about economics?
Awais Reply
sir...I just want to ask one question... Define the term contract curve? if you are free please help me to find this answer 🙏
Asui
it is a curve that we get after connecting the pareto optimal combinations of two consumers after their mutually beneficial trade offs
Awais
thank you so much 👍 sir
Asui
In economics, the contract curve refers to the set of points in an Edgeworth box diagram where both parties involved in a trade cannot be made better off without making one of them worse off. It represents the Pareto efficient allocations of goods between two individuals or entities, where neither p
Cornelius
In economics, the contract curve refers to the set of points in an Edgeworth box diagram where both parties involved in a trade cannot be made better off without making one of them worse off. It represents the Pareto efficient allocations of goods between two individuals or entities,
Cornelius
Suppose a consumer consuming two commodities X and Y has The following utility function u=X0.4 Y0.6. If the price of the X and Y are 2 and 3 respectively and income Constraint is birr 50. A,Calculate quantities of x and y which maximize utility. B,Calculate value of Lagrange multiplier. C,Calculate quantities of X and Y consumed with a given price. D,alculate optimum level of output .
Feyisa Reply
Answer
Feyisa
c
Jabir
the market for lemon has 10 potential consumers, each having an individual demand curve p=101-10Qi, where p is price in dollar's per cup and Qi is the number of cups demanded per week by the i th consumer.Find the market demand curve using algebra. Draw an individual demand curve and the market dema
Gsbwnw Reply
suppose the production function is given by ( L, K)=L¼K¾.assuming capital is fixed find APL and MPL. consider the following short run production function:Q=6L²-0.4L³ a) find the value of L that maximizes output b)find the value of L that maximizes marginal product
Abdureman
types of unemployment
Yomi Reply
What is the difference between perfect competition and monopolistic competition?
Mohammed
Got questions? Join the online conversation and get instant answers!
Jobilize.com Reply

Get Jobilize Job Search Mobile App in your pocket Now!

Get it on Google Play Download on the App Store Now


Source:  OpenStax, Mockingbird tales: readings in animal behavior. OpenStax CNX. Jan 12, 2011 Download for free at http://cnx.org/content/col11211/1.5
Google Play and the Google Play logo are trademarks of Google Inc.

Notification Switch

Would you like to follow the 'Mockingbird tales: readings in animal behavior' conversation and receive update notifications?

Ask