<< Chapter < Page Chapter >> Page >

P ( A B c C ) = p ( 5 ) = 2 p ( 3 ) = 2 P ( A c B C )

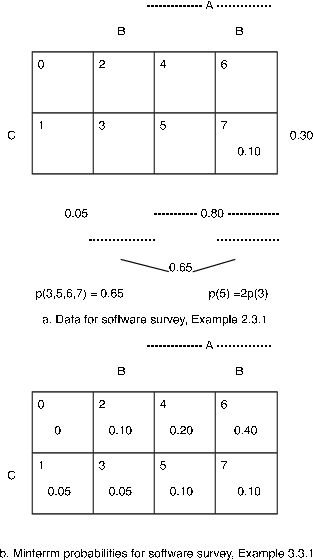
These data are shown on the minterm map in Figure 3a . We use the patterns displayed in the minterm map to aid in an algebraic solution forthe various minterm probabilities.

p ( 2 , 3 ) = p ( 0 , 1 , 2 , 3 ) - p ( 0 , 1 ) = 0 . 20 - 0 . 05 = 0 . 15

p ( 6 , 7 ) = p ( 2 , 3 , 6 , 7 ) - p ( 2 , 3 ) = 0 . 65 - 0 . 15 = 0 . 50

p ( 6 ) = p ( 6 , 7 ) - p ( 7 ) = 0 . 50 - 0 . 10 = 0 . 40

p ( 3 , 5 ) = p ( 3 , 5 , 6 , 7 ) - p ( 6 , 7 ) = 0 . 65 - 0 . 50 = 0 . 15 p ( 3 ) = 0 . 05 ,

p ( 5 ) = 0 . 10 p ( 2 ) = 0 . 10

p ( 1 ) = p ( 1 , 3 , 5 , 7 ) - p ( 3 , 5 ) - p ( 7 ) = 0 . 30 - 0 . 15 - 0 . 10 = 0 . 05 p ( 0 ) = 0

p ( 4 ) = p ( 4 , 5 , 6 , 7 ) - p ( 5 ) - p ( 6 , 7 ) = 0 . 80 - 0 . 10 - 0 . 50 = 0 . 20

Thus, all minterm probabilities are determined. They are displayed in Figure 3b . From these we get

P ( A c B C A B c C A B C c ) = p ( 3 , 5 , 6 ) = 0 . 05 + 0 . 10 + 0 . 40 = 0 . 55 and P ( A c B c C ) = p ( 1 ) = 0 . 05
Two 2x4 tables the first is labeled 'Data for software survey' and the second is labeled 'minterm probabilities for software survey'. Two 2x4 tables the first is labeled 'Data for software survey' and the second is labeled 'minterm probabilities for software survey'.
Minterm maps for software survey, [link]

Survey on personal computers

A survey of 1000 students shows that 565 have PC compatible desktop computers, 515 have Macintosh desktop computers, and 151 have laptop computers. 51 have all three,124 have both PC and laptop computers, 212 have at least two of the three, and twice as many own both PC and laptop as those who have both Macintosh desktop and laptop.A person is selected at random from this population. What is the probability he or she has at least one of these types of computer? Whatis the probability the person selected has only a laptop?

A 2x4 table demonstrating the minterm probabilities for the computer survey. A 2x4 table demonstrating the minterm probabilities for the computer survey.
Minterm probabilities for computer survey, [link]

SOLUTION

Let A = the event of owning a PC desktop, B = the event of owning a Macintosh desktop, and C = the event of owning a laptop. We utilize a minterm map for three variables to help determine minterm patterns. For example,the event A C = M 5 M 7 so that P ( A C ) = p ( 5 ) + p ( 7 ) = p ( 5 , 7 ) .

The data, expressed in terms of minterm probabilities, are:

P ( A ) = p ( 4 , 5 , 6 , 7 ) = 0 . 565 , hence P ( A c ) = p ( 0 , 1 , 2 , 3 ) = 0 . 435

P ( B ) = p ( 2 , 3 , 6 , 7 ) = 0 . 515 , hence P ( B c ) = p ( 0 , 1 , 4 , 5 ) = 0 . 485

P ( C ) = p ( 1 , 3 , 5 , 7 ) = 0 . 151 , hence P ( C c ) = p ( 0 , 2 , 4 , 6 ) = 0 . 849

P ( A B C ) = p ( 7 ) = 0 . 051 P ( A C ) = p ( 5 , 7 ) = 0 . 124

P ( A B A C B C ) = p ( 3 , 5 , 6 , 7 ) = 0 . 212

P ( A C ) = p ( 5 , 7 ) = 2 p ( 3 , 7 ) = 2 P ( B C )

We use the patterns displayed in the minterm map to aid in an algebraic solution for the various minterm probabilities.

p ( 5 ) = p ( 5 , 7 ) - p ( 7 ) = 0 . 124 - 0 . 051 = 0 . 073

p ( 1 , 3 ) = P ( A c C ) = 0 . 151 - 0 . 124 = 0 . 027 P ( A C c ) = p ( 4 , 6 ) = 0 . 565 - 0 . 124 = 0 . 441

p ( 3 , 7 ) = P ( B C ) = 0 . 124 / 2 = 0 . 062

p ( 3 ) = 0 . 062 - 0 . 051 = 0 . 011

p ( 6 ) = p ( 3 , 4 , 6 , 7 ) - p ( 3 ) - p ( 5 , 7 ) = 0 . 212 - 0 . 011 - 0 . 124 = 0 . 077

p ( 4 ) = P ( A ) - p ( 6 ) - p ( 5 , 7 ) = 0 . 565 - 0 . 077 - 0 . 1124 = 0 . 364

p ( 1 ) = p ( 1 , 3 ) - p ( 3 ) = 0 . 027 - 0 . 11 = 0 . 016

p ( 2 ) = P ( B ) - p ( 3 , 7 ) - p ( 6 ) = 0 . 515 - 0 . 062 - 0 . 077 = 0 . 376

p ( 0 ) = P ( C c ) - p ( 4 , 6 ) - p ( 2 ) = 0 . 849 - 0 . 441 - 0 . 376 = 0 . 032

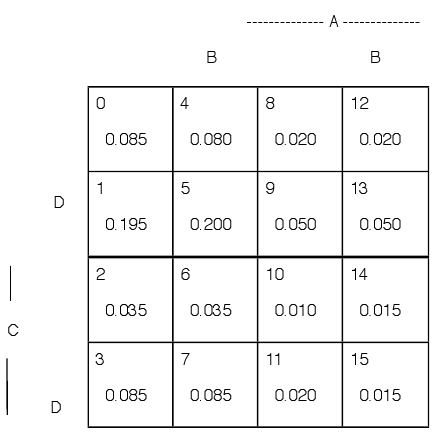
We have determined the minterm probabilities, which are displayed on the minterm map [link] . We may now compute the probability of any Boolean combination of the generating events A , B , C . Thus,

P ( A B C ) = 1 - P ( A c B c C c ) = 1 - p ( 0 ) = 0 . 968 and P ( A c B c C ) = p ( 1 ) = 0 . 016
Got questions? Get instant answers now!
A 4x4 table of minterm probabilities. A 4x4 table of minterm probabilities.
Minterm probabilities for opinion survey, [link]

Opinion survey

A survey of 1000 persons is made to determine their opinions onfour propositions. Let A , B , C , D be the events a person selected agrees with the respective propositions. Survey results show the following probabilities forvarious combinations:

P ( A ) = 0 . 200 , P ( B ) = 0 . 500 , P ( C ) = 0 . 300 , P ( D ) = 0 . 700 , P ( A ( B C c ) D c ) = 0 . 055
P ( A B C D c ) = 0 . 520 , P ( A c B C c D ) = 0 . 200 , P ( A B C D ) = 0 . 015 , P ( A B c C ) = 0 . 030
P ( A c B c C c D ) = 0 . 195 , P ( A c B C ) = 0 . 120 , P ( A c B c D c ) = 0 . 120 , P ( A C c ) = 0 . 140
P ( A C D c ) = 0 . 025 , P ( A B C c D c ) = 0 . 020

Determine the probabilities for each minterm and for each of the following combinations

A c ( B C c B c C ) – that is, not A and ( B or C , but not both)

A B C c – that is, A or ( B and not C )

SOLUTION

At the outset, it is not clear that the data are consistent or sufficient to determine the minterm probabilities. However, an examination of the data shows that there are sixteen items (includingthe fact that the sum of all minterm probabilities is one). Thus, there is hope, but no assurance, that a solution exists. A step elimination procedure, as in the previous examples,shows that all minterms can in fact be calculated. The results are displayed on the minterm map in [link] . It would be desirable to be able to analyze the problem systematically. The formulation above suggests a more systematic algebraic formulation which should makepossible machine aided solution.

Got questions? Get instant answers now!

Systematic formulation

Use of a minterm map has the advantage of visualizing the minterm expansion in direct relation to the Boolean combination. The algebraic solutions of the previousproblems involved ad hoc manipulations of the data minterm probability combinations to find the probability of the desired target combination. We seeka systematic formulation of the data as a set of linear algebraic equations with the minterm probabilities as unknowns, so that standard methods of solution may beemployed. Consider again the software survey of [link] .

The software survey problem reformulated

The data, expressed in terms of minterm probabilities, are:

P ( A ) = p ( 4 , 5 , 6 , 7 ) = 0 . 80

P ( B ) = p ( 2 , 3 , 6 , 7 ) = 0 . 65

P ( C ) = p ( 1 , 3 , 5 , 7 ) = 0 . 30

P ( A B C ) = p ( 7 ) = 0 . 10

P ( A c B c ) = p ( 0 , 1 ) = 0 . 05

P ( A B A C B C ) = p ( 3 , 5 , 6 , 7 ) = 0 . 65

P ( A B c C ) = p ( 5 ) = 2 p ( 3 ) = 2 P ( A c B C ) , so that p ( 5 ) - 2 p ( 3 ) = 0

We also have in any case

P ( Ω ) = P ( A A c ) = p ( 0 , 1 , 2 , 3 , 4 , 5 , 6 , 7 ) = 1

to complete the eight items of data needed for determining all eight minterm probabilities. The first datum can be expressed as an equation in mintermprobabilities:

0 p ( 0 ) + 0 p ( 1 ) + 0 p ( 2 ) + 0 p ( 3 ) + 1 p ( 4 ) + 1 p ( 5 ) + 1 p ( 6 ) + 1 p ( 7 ) = 0 . 80

This is an algebraic equation in p ( 0 ) , , p ( 7 ) with a matrix of coefficients

[ 0 0 0 0 1 1 1 1 ]

The others may be written out accordingly, giving eight linear algebraic equations in eight variables p ( 0 ) through p ( 7 ) . Each equation has a matrix or vector of zero-one coefficients indicating which minterms are included. These may be written in matrix form as follows:

1 1 1 1 1 1 1 1 0 0 0 0 1 1 1 1 0 0 1 1 0 0 1 1 0 1 0 1 0 1 0 1 0 0 0 0 0 0 0 1 1 1 0 0 0 0 0 0 0 0 0 1 0 1 1 1 0 0 0 - 2 0 1 0 0 p ( 0 ) p ( 1 ) p ( 2 ) p ( 3 ) p ( 4 ) p ( 5 ) p ( 6 ) p ( 7 ) = 1 0 . 80 0 . 65 0 . 30 0 . 10 0 . 05 0 . 65 0 = P ( Ω ) P ( A ) P ( B ) P ( C ) P ( A B C ) P ( A c B c ) P ( A B A C B C ) P ( A B c C ) - 2 P ( A c B C )
  • The patterns in the coefficient matrix are determined by logical operations . We obtained these with the aid of a minterm map.
  • The solution utilizes an algebraic procedure , which could be carried out in a variety of ways, including several standard computer packages for matrix operations.

We show in the module Minterm Vectors and MATLAB how we may use MATLAB for both aspects.

Got questions? Get instant answers now!

Indicator functions and the minterm expansion

Previous discussion of the indicator function shows that the indicator function for a Boolean combination of sets is a numerical valued function of the indicatorfunctions for the individual sets.

  • As an indicator function, it takes on only the values zero and one.
  • The value of the indicator function for any Boolean combination must be constant on each minterm. For example, for each ω in the minterm A B c C D c , we must have I A ( ω ) = 1 , I B ( ω ) = 0 , I C ( ω ) = 1 , and I D ( ω ) = 0 . Thus, any function of I A , I B , I C , I D must be constant over the minterm.
  • Consider a Boolean combination E of the generating sets. If ω is in E M i , then I E ( ω ) = 1 for all ω M i , so that M i E . Since each ω M i for some i , E must be the union of those minterms sharing an ω with E .
  • Let { M i : i J E } be the subclass of those minterms on which I E has the value one. Then
    E = J E M i
    which is the minterm expansion of E .

Get Jobilize Job Search Mobile App in your pocket Now!

Get it on Google Play Download on the App Store Now


Source:  OpenStax, Applied probability. OpenStax CNX. Aug 31, 2009 Download for free at http://cnx.org/content/col10708/1.6
Google Play and the Google Play logo are trademarks of Google Inc.

Notification Switch

Would you like to follow the 'Applied probability' conversation and receive update notifications?

Ask