| << Chapter < Page | Chapter >> Page > |
We have, thus far in our study of algebra, developed and used several methods for obtaining solutions to linear equations in both one and two variables. Quite often it is helpful to obtain a picture of the solutions to an equation. These pictures are called graphs and they can reveal information that may not be evident from the equation alone.
We have the following general rules regarding axes.
We shall always draw an axis as a straight line, and if more than one axis is required, we shall draw them so they are all mutually perpendicular (the lines forming the axes will be at angles to one another).
If we wish to graph the equation
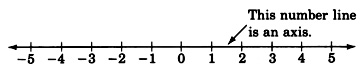
, we would need to construct a coordinate system consisting of a single axis (a single number line) since the equation consists of only one variable. We label the axis with the variable that appears in the equation.
We might interpret an equation in one variable as giving information in one-dimensional space. Since we live in three-dimensional space, one-dimensional space might be hard to imagine. Objects in one-dimensional space would have only length, no width or depth.
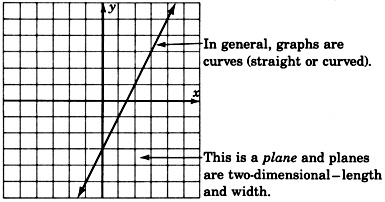
To graph an equation in two variables such as
, we would need to construct a coordinate system consisting of two mutually perpendicular number lines
(axes). We call the intersection of the two axes the
origin and label it with a 0. The two axes are simply number lines; one drawn horizontally, one drawn vertically.
Recall that an equation in two variables requires a solution to be a pair of numbers. The solutions can be written as ordered pairs
. Since the equation
involves the variables
and
, we label one axis
and the other axis
. In mathematics it is customary to label the horizontal axis with the independent variable and the vertical axis with the dependent variable.
We might interpret equations in two variables as giving information in two-dimensional space. Objects in two-dimensional space would have length and width, but no depth.
An equation in three variables, such as
, requires three mutually perpendicular axes, one for each variable. We would construct the following coordinate system and graph.
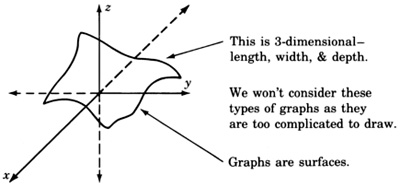
We might interpret equations in three variables as giving information about three-dimensional space.
To graph an equation in four variables, such as , would require four mutually perpendicular number lines. These graphs are left to the imagination.
We might interpret equations in four variables as giving information in four-dimensional space. Four-dimensional objects would have length, width, depth, and some other dimension.
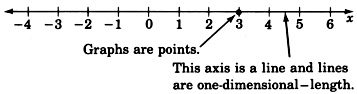
Graphing a linear equation in one variable involves solving the equation, then locating the solution on the axis (number line), and marking a point at this location. We have observed that graphs may reveal information that may not be evident from the original equation. The graphs of linear equations in one variable do not yield much, if any, information, but they serve as a foundation to graphs of higher dimension (graphs of two variables and three variables).
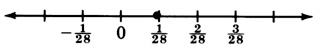
Graph the equation .
Solve the equation for and construct an axis. Since there is only one variable, we need only one axis. Label the axis .
![]()
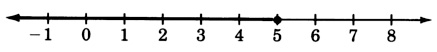
Graph the linear inequality .
We proceed by solving the inequality.
As we know, any value greater than or equal to 3 will satisfy the original inequality. Hence we have infinitely many solutions and, thus, infinitely many points to mark off on our graph.
![]()
The closed circle at 3 means that 3 is included as a solution. All the points beginning at 3 and in the direction of the arrow are solutions.
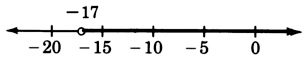
Graph the linear inequality .
We first solve the inequality.
Thus, all numbers strictly less than will satisfy the inequality and are thus solutions.
Since itself is not to be included as a solution, we draw an open circle at . The solutions are to the left of so we draw an arrow pointing to the left of to denote the region of solutions.
![]()
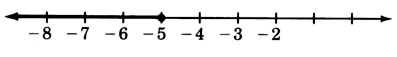
Graph the inequality .
We recognize this inequality as a compound inequality and solve it by subtracting 1 from all three parts.
Thus, the solution is all numbers between and 0, more precisely, all numbers greater than or equal to but strictly less than 0.
![]()
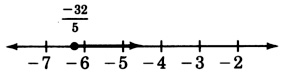
Graph the linear equation .
The solution is . Scaling the axis by units of 5 rather than 1, we obtain
![]()
For problems 1 - 25, graph the linear equations and inequalities.
( [link] ) Simplify .
( [link] ) List, if any should appear, the common factors in the expression .
( [link] ) Solve the inequality .
( [link] ) Solve the equation .
Notification Switch
Would you like to follow the 'Elementary algebra' conversation and receive update notifications?

|
|
|
|
|

|
|

|
|

|
|

|
|
|
|
|

|
|

|
|

|
|

|
|
|
|