| << Chapter < Page | Chapter >> Page > |
This module is one in a collection of modules designed for teaching GAME2302 Mathematical Applications for Game Development at Austin Community College in Austin, TX.
What you have learned
In the previous module, you learned:
What you will learn
In this module, you will learn how to display column matrices in a graphical format. This may help you to get a better grasp of the nature of column matricesand the results of adding, subtracting, and comparing them.
I recommend that you open another copy of this module in a separate browser window and use the following links to easily find and view the Figuresand Listings while you are reading about them.
Abstract mathematical concepts are often easier to grasp if you can visualize them in graphical format. For example, the nature of the followingequation often becomes more apparent once you learn that it is the equation of a straight line.
y = m*x + b
Similarly, the nature of the following equation often becomes more apparent once you learn that it is the equation of a parabola and you learn the generalshape of a parabola.
y = x^2 + k
where x^2 indicates x raised to the second power.
As mentioned earlier, in this module, you will learn how to display column matrices in a graphical format. This may help you to get a better grasp of the nature of column matricesand the results of adding, subtracting, and comparing them.
I will present and explain an interactive program that behaves as follows:
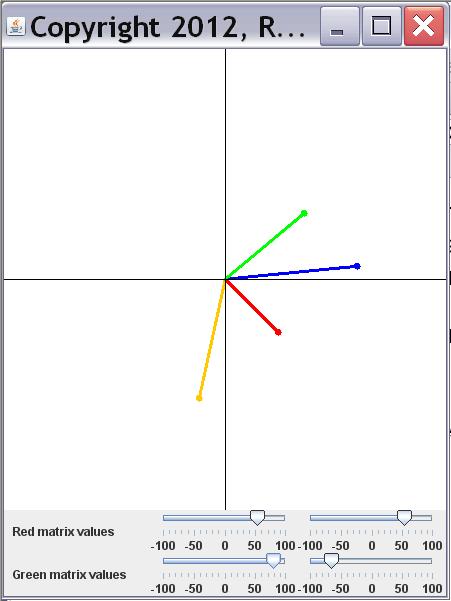
Two column matrices are created using values obtained from the sliders shown at the bottom of Figure 1 . One matrix is named redMatrix and the other matrix is named greenMatrix .
Figure 1 Sample graphical program output.

Two additional column matrices are created by adding and subtracting the original matrices.The matrix created by adding the red and green matrices is named blueMatrix . The matrix created by subtracting the green matrix from the red matrix is named orangeMatrix .

Notification Switch
Would you like to follow the 'Game 2302 - mathematical applications for game development' conversation and receive update notifications?