<< Chapter < Page Chapter >> Page >

Expansionary fiscal policy

Expansionary fiscal policy increases the level of aggregate demand, through either increases in government spending or reductions in taxes. Expansionary policy can do this by (1) increasing consumption by raising disposable income through cuts in personal income taxes or payroll taxes; (2) increasing investments by raising after-tax profits through cuts in business taxes; and (3) increasing government purchases through increased spending by the federal government on final goods and services and raising federal grants to state and local governments to increase their expenditures on final goods and services. Contractionary fiscal policy does the reverse: it decreases the level of aggregate demand by decreasing consumption, decreasing investments, and decreasing government spending, either through cuts in government spending or increases in taxes. The aggregate demand/aggregate supply model is useful in judging whether expansionary or contractionary fiscal policy is appropriate.

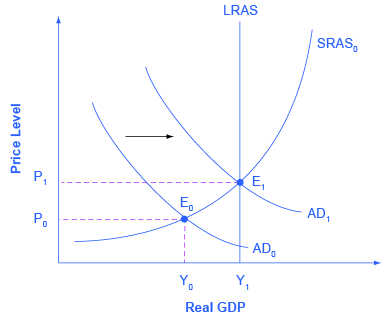
Consider first the situation in [link] , which is similar to the U.S. economy during the recession in 2008–2009. The intersection of aggregate demand (AD 0 ) and aggregate supply (SRAS 0 ) is occurring below the level of potential GDP as indicated by the LRAS curve. At the equilibrium (E 0 ), a recession occurs and unemployment rises. In this case, expansionary fiscal policy using tax cuts or increases in government spending can shift aggregate demand to AD 1 , closer to the full-employment level of output. In addition, the price level would rise back to the level P 1 associated with potential GDP.

Expansionary fiscal policy

The graph shows two aggregate demand curves that each intersect with an aggregate supply curve. Aggregate demand curve (AD sub 1) intersects with both the aggregate supply curve (AS sub 0) as well as the potential GDP line.
The original equilibrium (E 0 ) represents a recession, occurring at a quantity of output (Y 0 ) below potential GDP. However, a shift of aggregate demand from AD 0 to AD 1 , enacted through an expansionary fiscal policy, can move the economy to a new equilibrium output of E 1 at the level of potential GDP which is shown by the LRAS curve. Since the economy was originally producing below potential GDP, any inflationary increase in the price level from P 0 to P 1 that results should be relatively small.

Should the government use tax cuts or spending increases, or a mix of the two, to carry out expansionary fiscal policy? After the Great Recession of 2008–2009 (which started, actually, in very late 2007), U.S. government spending rose from 19.6% of GDP in 2007 to 24.6% in 2009, while tax revenues declined from 18.5% of GDP in 2007 to 14.8% in 2009. The choice between whether to use tax or spending tools often has a political tinge. As a general statement, conservatives and Republicans prefer to see expansionary fiscal policy carried out by tax cuts, while liberals and Democrats prefer that expansionary fiscal policy be implemented through spending increases. The Obama administration and Congress passed an $830 billion expansionary policy in early 2009 involving both tax cuts and increases in government spending, according to the Congressional Budget Office. However, state and local governments, whose budgets were also hard hit by the recession, began cutting their spending—a policy that offset federal expansionary policy.

Questions & Answers

how do you get the 2/50
Abba Reply
number of sport play by 50 student construct discrete data
Aminu Reply
width of the frangebany leaves on how to write a introduction
Theresa Reply
Solve the mean of variance
Veronica Reply
Step 1: Find the mean. To find the mean, add up all the scores, then divide them by the number of scores. ... Step 2: Find each score's deviation from the mean. ... Step 3: Square each deviation from the mean. ... Step 4: Find the sum of squares. ... Step 5: Divide the sum of squares by n – 1 or N.
kenneth
what is error
Yakuba Reply
Is mistake done to something
Vutshila
Hy
anas
hy
What is the life teble
anas
hy
Jibrin
statistics is the analyzing of data
Tajudeen Reply
what is statics?
Zelalem Reply
how do you calculate mean
Gloria Reply
diveving the sum if all values
Shaynaynay
let A1,A2 and A3 events be independent,show that (A1)^c, (A2)^c and (A3)^c are independent?
Fisaye Reply
what is statistics
Akhisani Reply
data collected all over the world
Shaynaynay
construct a less than and more than table
Imad Reply
The sample of 16 students is taken. The average age in the sample was 22 years with astandard deviation of 6 years. Construct a 95% confidence interval for the age of the population.
Aschalew Reply
Bhartdarshan' is an internet-based travel agency wherein customer can see videos of the cities they plant to visit. The number of hits daily is a normally distributed random variable with a mean of 10,000 and a standard deviation of 2,400 a. what is the probability of getting more than 12,000 hits? b. what is the probability of getting fewer than 9,000 hits?
Akshay Reply
Bhartdarshan'is an internet-based travel agency wherein customer can see videos of the cities they plan to visit. The number of hits daily is a normally distributed random variable with a mean of 10,000 and a standard deviation of 2,400. a. What is the probability of getting more than 12,000 hits
Akshay
1
Bright
Sorry i want to learn more about this question
Bright
Someone help
Bright
a= 0.20233 b=0.3384
Sufiyan
a
Shaynaynay
How do I interpret level of significance?
Mohd Reply
It depends on your business problem or in Machine Learning you could use ROC- AUC cruve to decide the threshold value
Shivam
how skewness and kurtosis are used in statistics
Owen Reply
yes what is it
Taneeya
Got questions? Join the online conversation and get instant answers!
Jobilize.com Reply

Get Jobilize Job Search Mobile App in your pocket Now!

Get it on Google Play Download on the App Store Now


Source:  OpenStax, Principles of macroeconomics for ap® courses. OpenStax CNX. Aug 24, 2015 Download for free at http://legacy.cnx.org/content/col11864/1.2
Google Play and the Google Play logo are trademarks of Google Inc.

Notification Switch

Would you like to follow the 'Principles of macroeconomics for ap® courses' conversation and receive update notifications?

Ask