

| << Chapter < Page | Chapter >> Page > |
| Equation to be estimated | Stata command |
| .ivreg y1 x2 x3 x5 (y2 y3 = x1 x4) | |
| .ivreg y2 x3 (y1 = x1 x2 x4 x5) |
An example from Stata. The Stata manual offers the following example analysis. Assume that you want to use state level data from the 1980 census to estimate the following system of equations:
and
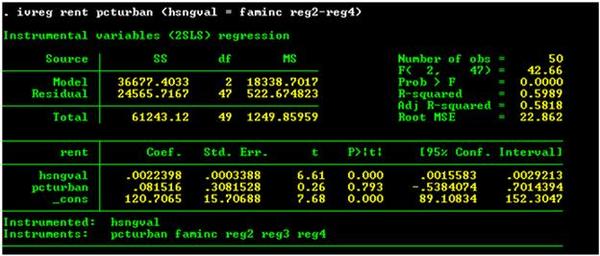
where hsngval is the median dollar value of owner-occupied housing; rent is the median monthly gross rent; fainc is family income; pcturban is the percent of the state population living in an urban area; and reg2 , reg3 , and reg4 are dummy variables that designate the region of the country where the state is located. In this example we focus on estimating (17).
We begin by loading the data set and describing the data.
. use http://www.stata-press.com/data/r8/hsng2
(1980 Census housing data)
.describe
| Contains data from http://www.stata-press.com/data/r8/hsng2.dta | |||||
| obs: 50 | 1980 Census housing data | ||||
| vars: 16 | 3 Sep 2002 12:25 | ||||
| size: 3,600 (99.7% of memory free) | |||||
| variable name | storage type | display format | value label | variable | label |
| state | str14 | % | 14s | State | |
| division | int | % | 8.0g | division | Census division |
| region | int | % | 8.0g | region | Region |
| pop | long | % | 10.0g | Population in 1980 | |
| popgrow | float | % | 6.1f | Pop. growth 1970-80 | |
| popden | int | % | 6.1f | Pop/sq. mile | |
| pcturban | float | % | 8.1f | Percent urban | |
| faminc | long | % | 8.2f | Median family inc., 1979 | |
| hsng | long | % | 10.0g | Hsng units 1980 | |
| hsnggrow | float | % | 8.1f | % housing growth | |
| hsngval | long | % | 9.2f | Median hsng value | |
| rent | long | % | 6.2f | Median gross rent | |
| reg1 | float | % | 9.0g | ||
| reg2 | float | % | 9.0g | ||
| reg3 | float | % | 9.0g | ||
| reg4 | float | % | 9.0g | ||
| Sorted by: state |
Now we estimate equation (17) using TSLS as shown in Figure 2.
Two-stages least square estimate of the example.
The manual continues the example to include some testing of the model including the Hausman test. Students using TSLS and IV should read the discussion in the Stata manual thoroughly.
Cigarette advertising and sales. A great deal of controversy exists over the issue of whether advertising expenditures affect sales. This controversy is particularly sharp when it affects policy decisions. An example of this phenomenon is the controversy over the impact of cigarette advertising on advertising sales. While many public policy experts advocate bans on cigarette advertising, a majority of economists caution against bans on cigarette advertising. The economists point out that there is little theoretical reasons to believe that cigarette advertising affects total demand for cigarettes. Instead, economists argue that cigarette advertising only affects brand choice and not the number of cigarettes that people smoke. Moreover, these economists point out that there is also little empirical evidence that supports the argument that cigarette advertising affects the demand for cigarettes. Given the negative impact advertising bans have on freedom of speech, most economists conclude that the negative effects of cigarette advertising bans outweigh the benefits of the bans.
Notification Switch
Would you like to follow the 'Econometrics for honors students' conversation and receive update notifications?

|
|

|
|

|
|

|
|

|
|

|
|

|
|

|
|

|
|

|