This module is from Elementary Algebra by Denny Burzynski and Wade Ellis, Jr.
In this chapter the student is shown how graphs provide information that is not always evident from the equation alone. The chapter begins by establishing the relationship between the variables in an equation, the number of coordinate axes necessary to construct its graph, and the spatial dimension of both the coordinate system and the graph. Interpretation of graphs is also emphasized throughout the chapter, beginning with the plotting of points. The slope formula is fully developed, progressing from verbal phrases to mathematical expressions. The expressions are then formed into an equation by explicitly stating that a ratio is a comparison of two quantities of the same type (e.g., distance, weight, or money). This approach benefits students who take future courses that use graphs to display information.The student is shown how to graph lines using the intercept method, the table method, and the slope-intercept method, as well as how to distinguish, by inspection, oblique and horizontal/vertical lines.
This module contains an overview of the chapter "Graphing Linear Equations and Inequalities in One and Two Variables".
Overview
- Using the Slope and Intercept to Graph a Line
Using the slope and intercept to graph a line
When a linear equation is given in the
general form ,
, we observed that an efficient graphical approach was the intercept method. We let
and computed the corresponding value of
, then let
and computed the corresponding value of
.
When an equation is written in the
slope-intercept form ,
, there are also efficient ways of constructing the graph. One way, but less efficient, is to choose two or three
and compute to find the corresponding
. However, computations are tedious, time consuming, and can lead to errors. Another way, the method listed below, makes use of the slope and the
for graphing the line. It is quick, simple, and involves no computations.
Graphing method
- Plot the
.
- Determine another point by using the
.
- Draw a line through the two points.
Recall that we defined the
as the ratio
. The numerator
represents the number of units that
changes and the denominator
represents the number of units that
changes. Suppose
. Then
is the number of units that
changes and
is the number of units that
changes. Since these changes occur simultaneously, start with your pencil at the
, move
units in the appropriate vertical direction, and then move
units in the appropriate horizontal direction. Mark a point at this location.
Sample set a
Graph the following lines.
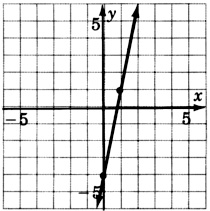
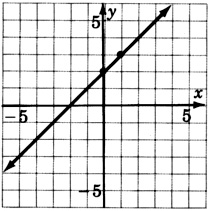
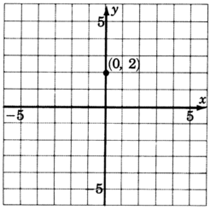
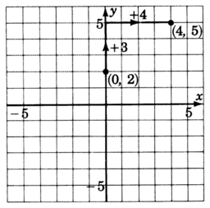
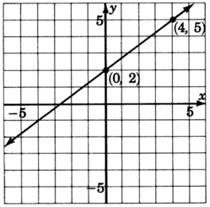
- The
is the point
. Thus the line crosses the
2 units above the origin. Mark a point at
.
- The slope,
, is
. This means that if we start at any point on the line and move our pencil
units up and then
units to the right, we’ll be back on the line. Start at a known point, the
. Move up
units, then move
units to the right. Mark a point at this location. (Note also that
. This means that if we start at any point on the line and move our pencil
units
down and
units to the
left , we’ll be back on the line. Note also that
. This means that if we start at any point on the line and move to the right
unit, we’ll have to move up
unit to get back on the line.)
- Draw a line through both points.
Got questions? Get instant answers now!
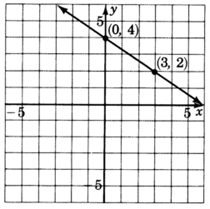
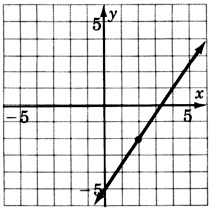
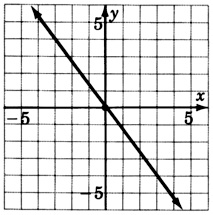
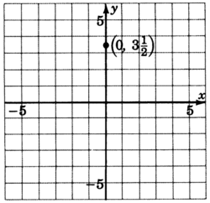
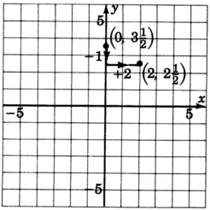
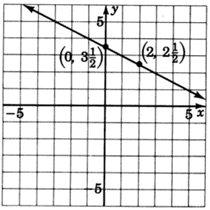
- The
is the point
. Thus the line crosses the
above the origin. Mark a point at
, or
.
- The slope,
, is
. We can write
as
. Thus, we start at a known point, the
, move
down one unit (because of the
), then move right
units. Mark a point at this location.
- Draw a line through both points.
Got questions? Get instant answers now!
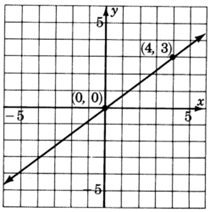
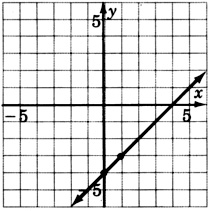
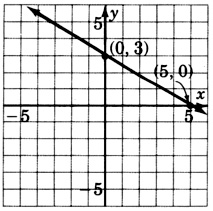
- We can put this equation into explicit slope-intercept by writing it as
.
The
is the point
, the origin. This line goes right through the origin.
- The slope,
, is
. Starting at the origin, we move up
units, then move to the right
units. Mark a point at this location.
- Draw a line through the two points.
Got questions? Get instant answers now!
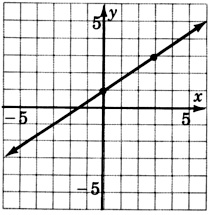
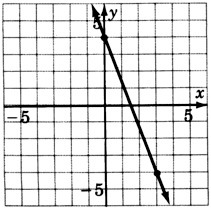
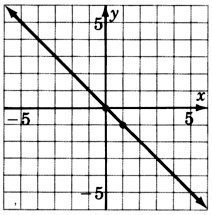
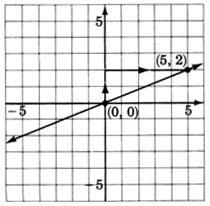
- The
is the point
. Thus the line crosses the
units below the origin. Mark a point at
.
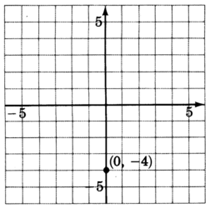
- The slope,
, is 2. If we write the slope as a fraction,
, we can read how to make the changes. Start at the known point
, move up
units, then move right
unit. Mark a point at this location.
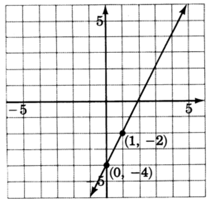
- Draw a line through the two points.
Got questions? Get instant answers now!
Practice set a
Use the
and the slope to graph each line.
Excercises
For the following problems, graph the equations.
Excersise for review