| << Chapter < Page | Chapter >> Page > |
Ideally, the average value of the new time series will be equal to the constant value of the sinusoid with zero frequency. This is because, ideally,the average value of the other sinusoid will be zero.
The product of any pair of sinusoids that do not have the same frequency will produce a new time series containing the sum of two sinusoids. One of the newsinusoids will have a frequency that is the sum of the frequencies of the two original sinusoids. The other sinusoid will have a frequency that is thedifference between the frequencies of the two original sinusoids.
Ideally, the average value of the new time series in this case will be equal to zero, because ideally the average value of each of the sinusoids that make upthe time series will be zero.
As we will see later, we don't always achieve the ideal.
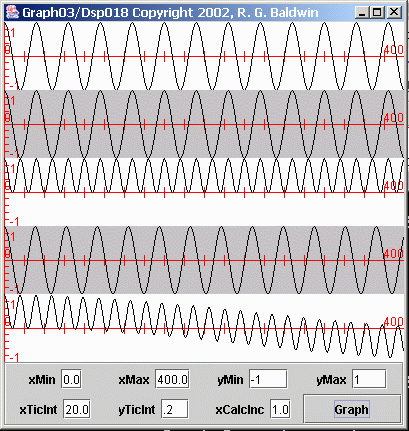
Let's examine some time series produced by multiplying sinusoids. Figure 1 , Figure 2 , and Figure 3 show the results of multiplying sinusoids having the same and different frequencies. Consider first the plots in Figure 1 .
| Figure 1. Products of sinusoids. |
|---|
 |
The top plot in Figure 1 shows a sinusoid whose frequency and sampling rate are such that it has 32 samples per cycle. The second plot from the top in Figure 1 is identical to the top plot. (To simplify the explanation, these two sinusoids are also cosine functions.)
The third plot down from the top in Figure 1 shows the product of these two sinusoids, which have the same frequency. If you examine the third plot, youwill notice several important characteristics.
By matching the peaks, you can determine that the frequency of the sinusoid in the third plot is double the frequency of each of the top two plots. (This is the sum of the frequencies of the two sinusoids that were multipliedtogether.)
Next, you will notice that the amplitude of the sinusoid in the third plot is half that of each of the first two plots. In addition, the entire sinusoid inthe third plot is in the positive value range.
The third plot is actually the sum of two sinusoids. One of the sinusoids has a frequency of zero, giving a constant value of 0.5. This constant value of 0.5is added to all the values in the other sinusoid, causing it to be plotted in the positive value region.
Later on, we will compute the average value of the time series in the third plot. Ideally, that average value will be the constant value produced by thezero-frequency sinusoid.
Now consider the bottom two plots in Figure 1 . The fourth plot down from the top is a cosine function whose frequency is almost, but not quite the same asthe frequency of the sinusoid in the top plot. The sinusoid in the top plot has 32 samples per cycle while the sinusoid in the fourth plot has 31 samples percycle.

Notification Switch
Would you like to follow the 'Digital signal processing - dsp' conversation and receive update notifications?