In this problem, we want to understand the temperature
component of our environment using Fourier series andlinear system theory. The file
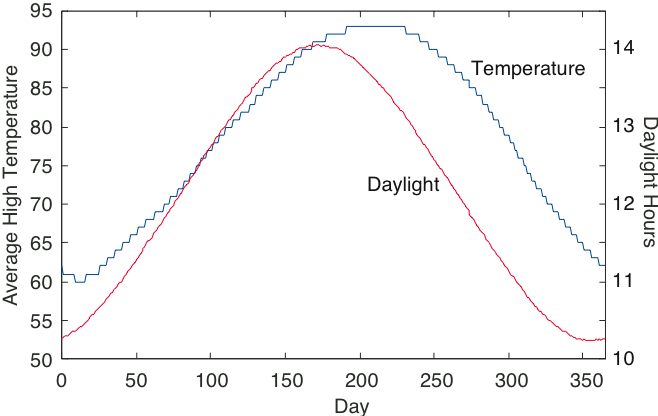
temperature.mat contains these data
(daylight hours in the first row, corresponding averagedaily highs in the second) for Houston, Texas.
Let the length of day serve as the sole input to asystem having an output equal to the average daily
temperature. Examining the plots of input andoutput, would you say that the system is linear or
not? How did you reach you conclusion?
Find the first five terms
(
,
... ,
)
of the complex Fourier series for each signal.Use the following formula that approximates the integral required to find the Fourier coefficients.
What is the harmonic distortion in the two signals?
Exclude
from this calculation.
Because the harmonic distortion is small, let's
concentrate only on the first harmonic. What is thephase shift between input and output signals?
Find the transfer function of the simplest possible
linear model that would describe the data.Characterize and interpret the structure of this
model. In particular, give a physical explanationfor the phase shift.
Predict what the output would be if the model had no
phase shift. Would days be hotter? If so, by howmuch?
Fourier transform pairs
Find the Fourier or inverse Fourier transform of the
following.
Duality in fourier transforms
"Duality" means that the Fourier transform and the inverse Fourier transform are very similar.
Consequently, the waveform
in the time domain and the spectrum
have a Fourier transform and an inverse Fourier transform, respectively, that are very similar.
Calculate the Fourier transform of the signal shown
below .
Calculate the inverse Fourier transform of the spectrum shown
below .
How are these answers related?
What is the general relationship between the Fourier transform of
and the inverse transform of
?
Spectra of pulse sequences
Pulse sequences occur often in digital communication and in other fields as well.
What are their spectral properties?
Calculate the Fourier transform of the single pulse shown
below .
Calculate the Fourier transform of the two-pulse sequence shown
below .
Calculate the Fourier transform for the
ten -pulse sequence shown in
below .
You should look for a general expression that holds for sequences of any length.
Using Matlab, plot the magnitudes of the three spectra.
Describe how the spectra change as the number of repeated pulses increases.
Spectra of digital communication signals
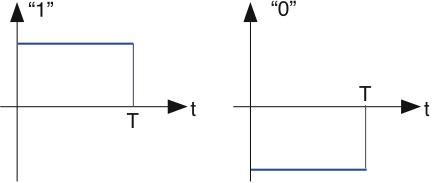
One way to represent bits with signals is shown in
[link] .
If the value of a bit is a “1”, it is represented by a positive pulse of duration
.
If it is a “0”, it is represented by a negative pulse of the same duration.To represent a sequence of bits, the appropriately chosen pulses are placed one after the other.
What is the spectrum of the waveform that represents the alternating bit sequence “...01010101...”?
This signal's bandwidth is defined to be the frequency range over which 90% of the power is contained.
What is this signal's bandwidth?
Suppose the bit sequence becomes “...00110011...”.
Now what is the bandwidth?
Questions & Answers
Ayele, K., 2003. Introductory Economics, 3rd ed., Addis Ababa.
what's the difference between a firm and an industry
Abdul
firm is the unit which transform inputs to output where as industry contain combination of firms with similar production 😅😅
Abdulraufu
Suppose the demand function that a firm faces shifted from
Qd 120 3P
to
Qd 90 3P
and the supply function has shifted from
QS
20 2P
to
QS
10 2P .
a) Find the effect of this change on price and quantity.
b) Which of the changes in demand and supply is higher?
Demand curve shows that how supply and others conditions affect on demand of a particular thing and what percent demand increase whith increase of supply of goods
Israr
Hi Sir please how do u calculate Cross elastic demand and income elastic demand?
Abari
Got questions? Join the online conversation and get instant answers!