<< Chapter < Page
  Digital signal processing - dsp     Page 3 / 24
Chapter >> Page >

Listings

  • Listing 1 . Beginning of the main method.
  • Listing 2 . A 3D parabolic surface,
  • Listing 3 . Display six surface images.
  • Listing 4 . Beginning of the ImgMod29 class.
  • Listing 5 . Establish display format for log conversion.
  • Listing 6 . Copy the input elevation data.
  • Listing 7 . Convert to log data if required
  • Listing 8 . Normalize the surface elevation data.
  • Listing 9 . The method named scaleTheSurfaceData.
  • Listing 10 . Create an appropriate pair of Canvas objects.
  • Listing 11 . Add the Canvas objects to the Frame.
  • Listing 12 . Register an anonymous WindowListener object.
  • Listing 13 . The method named getCenter.
  • Listing 14 . Beginning of the class named CanvasType0surface.
  • Listing 15 . Beginning of overridden paint method.
  • Listing 16 . Instantiate a Color object.
  • Listing 17 . Set colors and draw squares.
  • Listing 18 . Draw the optional red axes.
  • Listing 19 . Beginning of the class named CanvasType0scale .
  • Listing 20 . The overridden paint method.
  • Listing 21 . Beginning of the class named CanvasType1surface.
  • Listing 22 . Beginning of the overridden paint method.
  • Listing 23 . Set white and black for max and min values.
  • Listing 24 . Process elevations from 1 to 63 inclusive.
  • Listing 25 . Processing the other three ranges.
  • Listing 26 . The method named getColorPalette.
  • Listing 27 . Beginning of overridden paint method.
  • Listing 28 . Set the color value.
  • Listing 29 . Source code for ImgMod29.java.

General Discussion

Displaying 3D data can be fairly difficult

One of the more difficult aspects of engineering and scientific computing is displaying three-dimensional (3D) surfaces in ways that are meaningful to persons who need to view and to analyze those surfaces. The basic problem isthat it is necessary to display the 3D surface on a 2D media, such as a computer screen.

(At least that was true before the advent of 3D printers. However, as of October 2015, a 3D printer is not readily available for routine use by most people.)

Therefore, some compromise is always required.

Different approaches are available

Various approaches have been devised for accomplishing this objective including:

A 3D plotting program

I will provide and explain a program in this module that makes it very easy to display a 3D surface as a Grayscale plot, a Color Shift plot, or a ColorContour plot. The program supports six different plotting formats. Three of those plotting formats are illustrated in Figure 1 .

(The images shown in Figure 1 are different views of the wave-number spectrum resulting from performing a 2D Fourier Transform on a box in thespace domain. The use of 2D Fourier Transforms will be the main topic of a future module.)

Figure 1. 3D views of a wave-number spectrum.
Missing Figure.

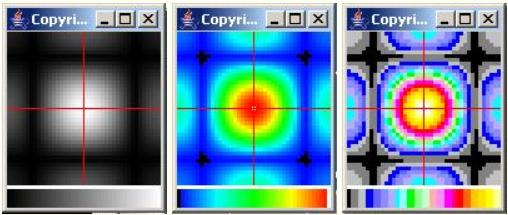
Figure 1 shows the same 3D surface plotted using three different plotting formats. Going from left to right, Figure 1 shows:

  • Grayscale plot
  • Color Shift plot
  • Color Contour plot

Grayscale plot

The plot on the left in Figure 1 is the old standby method in which the elevation of each point on the surface is represented by a shade of gray withthe highest elevation being white and the lowest elevation being black.

Questions & Answers

if three forces F1.f2 .f3 act at a point on a Cartesian plane in the daigram .....so if the question says write down the x and y components ..... I really don't understand
Syamthanda Reply
hey , can you please explain oxidation reaction & redox ?
Boitumelo Reply
hey , can you please explain oxidation reaction and redox ?
Boitumelo
for grade 12 or grade 11?
Sibulele
the value of V1 and V2
Tumelo Reply
advantages of electrons in a circuit
Rethabile Reply
we're do you find electromagnetism past papers
Ntombifuthi
what a normal force
Tholulwazi Reply
it is the force or component of the force that the surface exert on an object incontact with it and which acts perpendicular to the surface
Sihle
what is physics?
Petrus Reply
what is the half reaction of Potassium and chlorine
Anna Reply
how to calculate coefficient of static friction
Lisa Reply
how to calculate static friction
Lisa
How to calculate a current
Tumelo
how to calculate the magnitude of horizontal component of the applied force
Mogano
How to calculate force
Monambi
a structure of a thermocouple used to measure inner temperature
Anna Reply
a fixed gas of a mass is held at standard pressure temperature of 15 degrees Celsius .Calculate the temperature of the gas in Celsius if the pressure is changed to 2×10 to the power 4
Amahle Reply
How is energy being used in bonding?
Raymond Reply
what is acceleration
Syamthanda Reply
a rate of change in velocity of an object whith respect to time
Khuthadzo
how can we find the moment of torque of a circular object
Kidist
Acceleration is a rate of change in velocity.
Justice
t =r×f
Khuthadzo
how to calculate tension by substitution
Precious Reply
hi
Shongi
hi
Leago
use fnet method. how many obects are being calculated ?
Khuthadzo
khuthadzo hii
Hulisani
how to calculate acceleration and tension force
Lungile Reply
you use Fnet equals ma , newtoms second law formula
Masego
please help me with vectors in two dimensions
Mulaudzi Reply
how to calculate normal force
Mulaudzi
Got questions? Join the online conversation and get instant answers!
Jobilize.com Reply

Get Jobilize Job Search Mobile App in your pocket Now!

Get it on Google Play Download on the App Store Now


Source:  OpenStax, Digital signal processing - dsp. OpenStax CNX. Jan 06, 2016 Download for free at https://legacy.cnx.org/content/col11642/1.38
Google Play and the Google Play logo are trademarks of Google Inc.

Notification Switch

Would you like to follow the 'Digital signal processing - dsp' conversation and receive update notifications?

Ask