<< Chapter < Page Chapter >> Page >

Mechanisms

The way in which schools operate is something that has undergone much research recently, especially since the advent of modeling technologies that can accurately represent fish populations. The basics of the mechanisms of schooling are known, but much is yet to be understood. It has been determined that across most species, the mechanisms of schooling are more or less conserved and rely on individual physiology and environment (Gobert et al 2001). Mechanisms are evolutionarily relevant to the study of aggregation because they demonstrate the results of generations of selective pressure, and the mechanism behind how the school physically operates is the basis for why predator avoidance, foraging, and sexual schooling can occur.

Sensory perception

Sensory perception, or some form of identifying how one relates to others spatially within a school, is imperative to avoid collisions and synchronize movement. Models show that for the school to move and change direction, strong boundaries of repulsion, neutrality, and attraction must exist in order to shape the school. This suggests a sensory mechanism works to establish these regions and provide for the uniformity within schools. (Grunbam et al 2007) . This is supported by response mechanisms at the individual level that create these accommodations (Gueron 1996). It is unknown when these mechanisms evolved, however it is surmised that they evolved in conjunction with the aggregate behavior of schools. Either way, these mechanisms subtly allow competition for safe positions to continue while mostly maintaining a constant dynamic that allows the school to benefit the individuals that comprise it.

Knowing your place in the school

Flow chart showing direction changes.

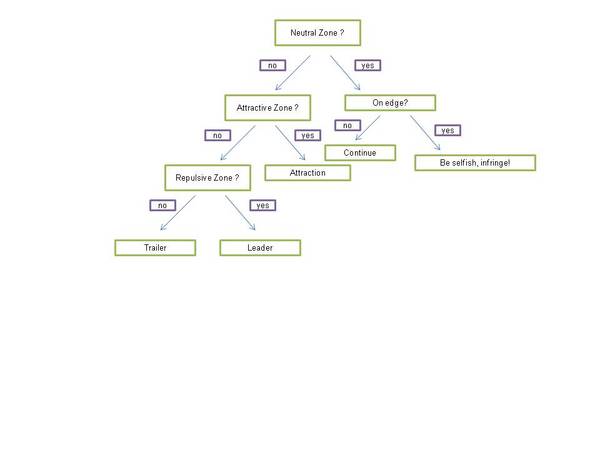
This flow chart shows the mechanism of identifying how one should alter direction in order to stay with the school (Gueron 1996). There are several zones in which evaluation needs to occur. The neutral zone means that you are neither too close nor too far from any one, and if one is on the edge and in the neutral zone, you may try to squeeze into the repulsive zone as it is more advantageous for you to be closer to the school. Even in the mechanics of schooling, the individual selfishness that is at the heart of schooling is very evident. If one is not on the edge, then one will try to maintain your position far enough from each fish so that you are out of your neighbors’ repulsive zones, but not so far so that you are in the attractive zones. The repulsive zone means one is too close, and the attractive zone means one is too far. These zones are models of how position evaluation likely occurs in order to maintain the equal spacing and uniformity of the school (Grunbam et al 2007).

Density and volume

The density and volume of a school often dictate the schools shape and mechanics. It is observed that under specific positions and velocities, aggregations are more likely to form. However, it is not known whether these positions and velocities occur by chance or if they are contrived by individuals seeking to school (Cucker and Mordecki 2007). Once schools are made, the size of the school is regulated by normal distributions, and fission or fusion events occur when the school is either too large or too small in relation to normal distribution (Niwa 1998). In order for these events to occur, an optimal degree of synchronization must occur, though it cannot be determined if this synchronization is a function of school size or if individuals adjust synchronization in anticipation of changes (Skaret and Vabo 2008). Additional observations indicate that speed regulates the density of a school, with faster swimming resulting in denser schools (Pitcher 1979). These observations, however, often cannot separate individual intent from coincidental happenings. Studies show that just as predators tailor their hunting styles to suit the school, fishing gear can be evaluated and updated to reflect the hydromechanics within a school (Weihs 1973). The application of this information is a creative way that brings schooling theory and research back to where it initially began - practical ways for humans to acquire food, a noticeable parallel to the coevolution of predator and prey.

Questions & Answers

What are the factors that affect demand for a commodity
Florence Reply
differentiate between demand and supply giving examples
Lambiv Reply
differentiated between demand and supply using examples
Lambiv
what is labour ?
Lambiv
how will I do?
Venny Reply
how is the graph works?I don't fully understand
Rezat Reply
information
Eliyee
devaluation
Eliyee
t
WARKISA
hi guys good evening to all
Lambiv
multiple choice question
Aster Reply
appreciation
Eliyee
explain perfect market
Lindiwe Reply
In economics, a perfect market refers to a theoretical construct where all participants have perfect information, goods are homogenous, there are no barriers to entry or exit, and prices are determined solely by supply and demand. It's an idealized model used for analysis,
Ezea
What is ceteris paribus?
Shukri Reply
other things being equal
AI-Robot
When MP₁ becomes negative, TP start to decline. Extuples Suppose that the short-run production function of certain cut-flower firm is given by: Q=4KL-0.6K2 - 0.112 • Where is quantity of cut flower produced, I is labour input and K is fixed capital input (K-5). Determine the average product of lab
Kelo
Extuples Suppose that the short-run production function of certain cut-flower firm is given by: Q=4KL-0.6K2 - 0.112 • Where is quantity of cut flower produced, I is labour input and K is fixed capital input (K-5). Determine the average product of labour (APL) and marginal product of labour (MPL)
Kelo
yes,thank you
Shukri
Can I ask you other question?
Shukri
what is monopoly mean?
Habtamu Reply
What is different between quantity demand and demand?
Shukri Reply
Quantity demanded refers to the specific amount of a good or service that consumers are willing and able to purchase at a give price and within a specific time period. Demand, on the other hand, is a broader concept that encompasses the entire relationship between price and quantity demanded
Ezea
ok
Shukri
how do you save a country economic situation when it's falling apart
Lilia Reply
what is the difference between economic growth and development
Fiker Reply
Economic growth as an increase in the production and consumption of goods and services within an economy.but Economic development as a broader concept that encompasses not only economic growth but also social & human well being.
Shukri
production function means
Jabir
What do you think is more important to focus on when considering inequality ?
Abdisa Reply
any question about economics?
Awais Reply
sir...I just want to ask one question... Define the term contract curve? if you are free please help me to find this answer 🙏
Asui
it is a curve that we get after connecting the pareto optimal combinations of two consumers after their mutually beneficial trade offs
Awais
thank you so much 👍 sir
Asui
In economics, the contract curve refers to the set of points in an Edgeworth box diagram where both parties involved in a trade cannot be made better off without making one of them worse off. It represents the Pareto efficient allocations of goods between two individuals or entities, where neither p
Cornelius
In economics, the contract curve refers to the set of points in an Edgeworth box diagram where both parties involved in a trade cannot be made better off without making one of them worse off. It represents the Pareto efficient allocations of goods between two individuals or entities,
Cornelius
Suppose a consumer consuming two commodities X and Y has The following utility function u=X0.4 Y0.6. If the price of the X and Y are 2 and 3 respectively and income Constraint is birr 50. A,Calculate quantities of x and y which maximize utility. B,Calculate value of Lagrange multiplier. C,Calculate quantities of X and Y consumed with a given price. D,alculate optimum level of output .
Feyisa Reply
Answer
Feyisa
c
Jabir
the market for lemon has 10 potential consumers, each having an individual demand curve p=101-10Qi, where p is price in dollar's per cup and Qi is the number of cups demanded per week by the i th consumer.Find the market demand curve using algebra. Draw an individual demand curve and the market dema
Gsbwnw Reply
suppose the production function is given by ( L, K)=L¼K¾.assuming capital is fixed find APL and MPL. consider the following short run production function:Q=6L²-0.4L³ a) find the value of L that maximizes output b)find the value of L that maximizes marginal product
Abdureman
Got questions? Join the online conversation and get instant answers!
Jobilize.com Reply

Get Jobilize Job Search Mobile App in your pocket Now!

Get it on Google Play Download on the App Store Now


Source:  OpenStax, Mockingbird tales: readings in animal behavior. OpenStax CNX. Jan 12, 2011 Download for free at http://cnx.org/content/col11211/1.5
Google Play and the Google Play logo are trademarks of Google Inc.

Notification Switch

Would you like to follow the 'Mockingbird tales: readings in animal behavior' conversation and receive update notifications?

Ask