

| << Chapter < Page | Chapter >> Page > |
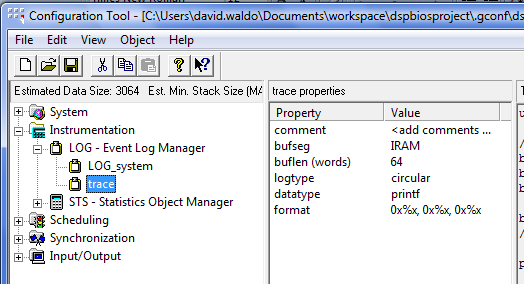
To set up the LOG object, expand the Instrumentation item and right click on the LOG item. Select Insert LOG and give the LOG object the name trace .


Next insert a task (TSK) object and give it the name TSK0 .

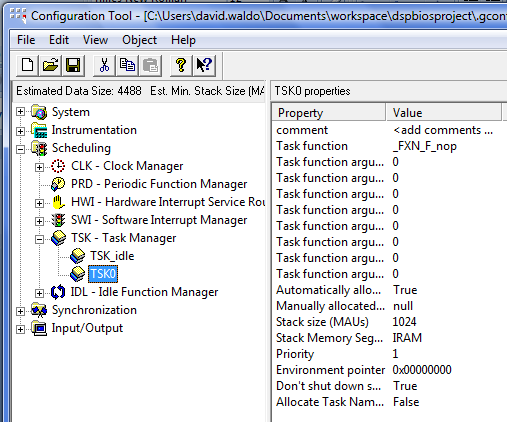
In order for the TSK object to be associated with a function the Task function name must be changed. Right click on the
TSK0 object and select
Properties . Under the Function tab, type
_funTSK0 . Be sure to include the underscore at the beginning of the name. The C program function name will be
funTSK0 but the assembly code name will have an underscore at the beginning. Be sure to note that the name of the task object and the name of the function that it uses cannot be the same name. In this example the object name is TSK0 and the function name if
funTSK0 .
After the objects have been set up, save and close the configuration file.
When your project gets built, the configuration file automatically generates files. One of these files is a header file that can be used in your programs. If your configuration file is named
file.tcf then the header file that gets made will be called
filecfg.h . In the source files that use the DSP/BIOS object this header file can be included. Use a statement like:
#include "filecfg.h"
When using DSP/BIOS in a project, very little code is in the
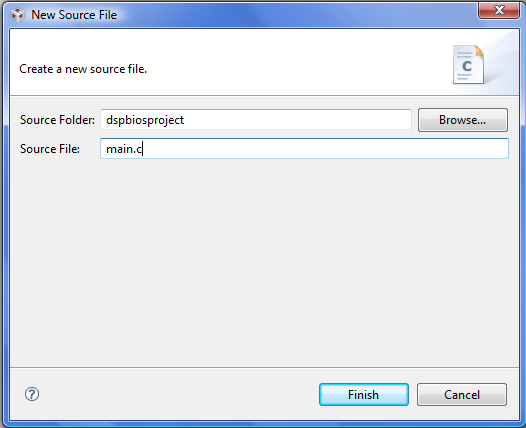
main function. Other objects are used like tasks and interrupts. In this example a simple task will be made that prints to a LOG buffer. Create a new C program file. Select
File->New->Source File .

The New Source File dialog opens and you can enter the source file name. Add a .c extension for a C program file. The source folder should be the folder of your project. Select Finish and a new file is opened.
Enter the C code. The file must contain a main function. After entering the code, save the file.
#include<std.h>#include<log.h>#include<tsk.h>#include "dspbiosprojectcfg.h" //header generated by dspbiosproject.tcfvoid main(void){
    LOG_printf(&trace,"In main function");
    return;}void funTSK0(void){
    LOG_printf(&trace,"In TSK0");
    return;}
In the code above, note that the header file
dspbiosprojectcfg.h is included. This is the header file generated by the DSP/BIOS configuration file. Also, the function
funTSK0 is the function that will be executed when TSK0 gets scheduled to run.
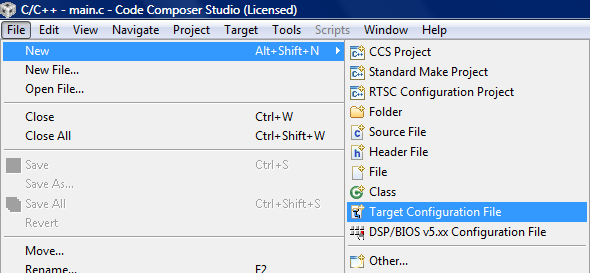
In order to build and run your project you need to have a target configuration. This file will contain information about the emulator that will be used and the target processor. In this module the target configuration will be the TI simulator for the C6713 processor.
First select File->New->Target Configuration File .
In the New Target Configuration dialog enter the configuration file name ending in the .ccxml file extension. Put the file in the project directory. Select Finish and a new target configuration file opens.

In the target configuration, select the connection needed (simulator or some type of emulator, etc.) and the type of device. In this example the TI simulator is used with the C6713 little endian simulator device. Select Save when done.

Now the target configuration is in the project.

To start a debug session either select Target->Debug Active Project or press the debug icon in the menu bar.

When the debug session starts the code files are compiled and linked into an executable file and the file is loaded onto the target. The initialization code is executed and the program is halted at the beginning of the
main function.

In order to be able to see the LOG print text the real time analysis (RTA) data stream must be turned on. Select Tools->RTA->Print Logs which will open up the LOG print window. Select the Stream RTA data button on the right part of the menu bar. The icon is depressed in the figure.

Icons on the debug window can be used to run the program and other debugging tools.

Press the green arrow to run the program. The
main function will be executed and the program will leave the
main function. After the
main function executes the
TSK0 object is schedule and the
tsk0 function is executed. Both functions print to the
trace LOG object. The output can be viewed in the
Printf Logs window.

Notification Switch
Would you like to follow the 'Ti dsp/bios lab' conversation and receive update notifications?

|
|

|
|

|
|

|
|

|
|

|
|
|
|
|

|
|

|
|
|
|