

| << Chapter < Page | Chapter >> Page > |
The structure of ecosystems can be visualized with ecological pyramids, which were first described by the pioneering studies of Charles Elton in the 1920s. Ecological pyramids show the relative amounts of various parameters (such as number of organisms, energy, and biomass) across trophic levels.
Pyramids of numbers can be either upright or inverted, depending on the ecosystem. As shown in [link] , typical grassland during the summer has a base of many plants and the numbers of organisms decrease at each trophic level. However, during the summer in a temperate forest, the base of the pyramid consists of few trees compared with the number of primary consumers, mostly insects. Because trees are large, they have great photosynthetic capability, and dominate other plants in this ecosystem to obtain sunlight. Even in smaller numbers, primary producers in forests are still capable of supporting other trophic levels.
Another way to visualize ecosystem structure is with pyramids of biomass. This pyramid measures the amount of energy converted into living tissue at the different trophic levels. Using the Silver Springs ecosystem example, this data exhibits an upright biomass pyramid ( [link] ), whereas the pyramid from the English Channel example is inverted. The plants (primary producers) of the Silver Springs ecosystem make up a large percentage of the biomass found there. However, the phytoplankton in the English Channel example make up less biomass than the primary consumers, the zooplankton. As with inverted pyramids of numbers, this inverted pyramid is not due to a lack of productivity from the primary producers, but results from the high turnover rate of the phytoplankton. The phytoplankton are consumed rapidly by the primary consumers, thus, minimizing their biomass at any particular point in time. However, phytoplankton reproduce quickly, thus they are able to support the rest of the ecosystem.
Pyramid ecosystem modeling can also be used to show energy flow through the trophic levels. Notice that these numbers are the same as those used in the energy flow compartment diagram in [link] . Pyramids of energy are always upright, and an ecosystem without sufficient primary productivity cannot be supported. All types of ecological pyramids are useful for characterizing ecosystem structure. However, in the study of energy flow through the ecosystem, pyramids of energy are the most consistent and representative models of ecosystem structure ( [link] ).
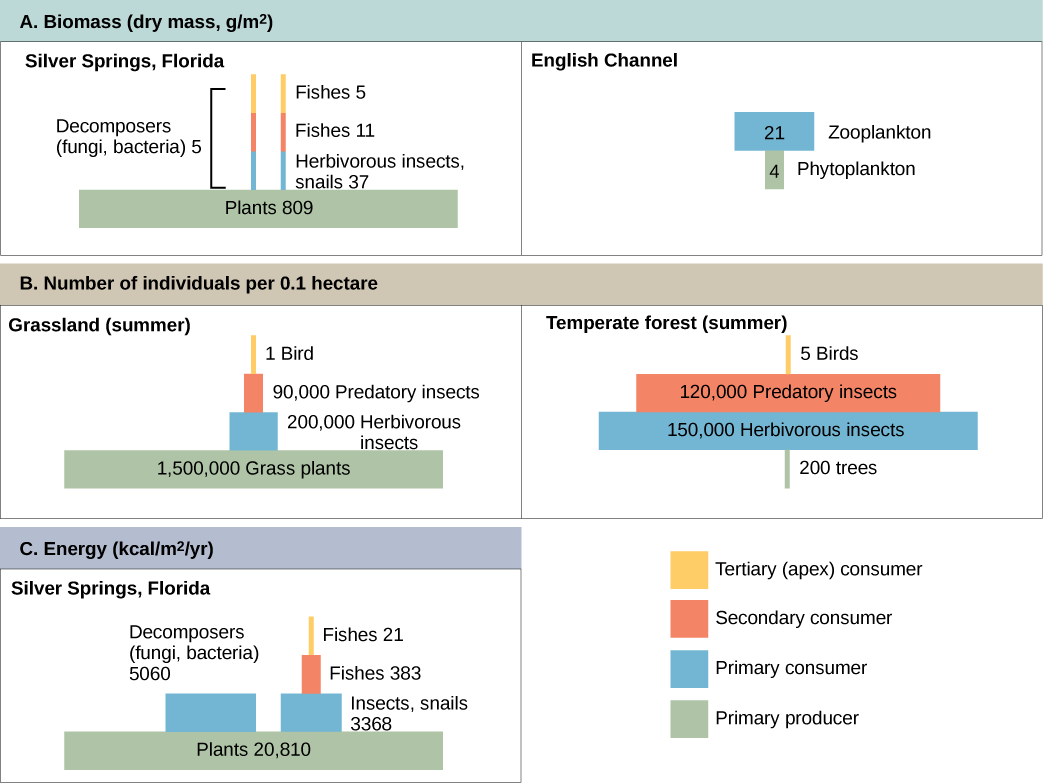
Pyramids depicting the number of organisms or biomass may be inverted, upright, or even diamond-shaped. Energy pyramids, however, are always upright. Why?
One of the most important environmental consequences of ecosystem dynamics is biomagnification. Biomagnification is the increasing concentration of persistent, toxic substances in organisms at each trophic level, from the primary producers to the apex consumers. Many substances have been shown to bioaccumulate, including classical studies with the pesticide d ichloro d iphenyl t richloroethane (DDT), which was published in the 1960s bestseller, Silent Spring , by Rachel Carson. DDT was a commonly used pesticide before its dangers became known. In some aquatic ecosystems, organisms from each trophic level consumed many organisms of the lower level, which caused DDT to increase in birds (apex consumers) that ate fish. Thus, the birds accumulated sufficient amounts of DDT to cause fragility in their eggshells. This effect increased egg breakage during nesting and was shown to have adverse effects on these bird populations. The use of DDT was banned in the United States in the 1970s.
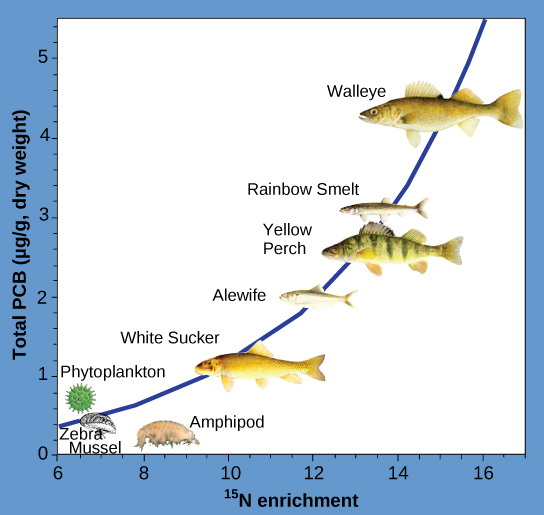
Other substances that biomagnify are polychlorinated biphenyls (PCBs), which were used in coolant liquids in the United States until their use was banned in 1979, and heavy metals, such as mercury, lead, and cadmium. These substances were best studied in aquatic ecosystems, where fish species at different trophic levels accumulate toxic substances brought through the ecosystem by the primary producers. As illustrated in a study performed by the National Oceanic and Atmospheric Administration (NOAA) in the Saginaw Bay of Lake Huron ( [link] ), PCB concentrations increased from the ecosystem’s primary producers (phytoplankton) through the different trophic levels of fish species. The apex consumer (walleye) has more than four times the amount of PCBs compared to phytoplankton. Also, based on results from other studies, birds that eat these fish may have PCB levels at least one order of magnitude higher than those found in the lake fish.
Other concerns have been raised by the accumulation of heavy metals, such as mercury and cadmium, in certain types of seafood. The United States Environmental Protection Agency (EPA) recommends that pregnant women and young children should not consume any swordfish, shark, king mackerel, or tilefish because of their high mercury content. These individuals are advised to eat fish low in mercury: salmon, tilapia, shrimp, pollock, and catfish. Biomagnification is a good example of how ecosystem dynamics can affect our everyday lives, even influencing the food we eat.
Organisms in an ecosystem acquire energy in a variety of ways, which is transferred between trophic levels as the energy flows from the bottom to the top of the food web, with energy being lost at each transfer. The efficiency of these transfers is important for understanding the different behaviors and eating habits of warm-blooded versus cold-blooded animals. Modeling of ecosystem energy is best done with ecological pyramids of energy, although other ecological pyramids provide other vital information about ecosystem structure.
[link] Pyramids depicting the number of organisms or biomass may be inverted, upright, or even diamond-shaped. Energy pyramids, however, are always upright. Why?
[link] Pyramids of organisms may be inverted or diamond-shaped because a large organism, such as a tree, can sustain many smaller organisms. Likewise, a low biomass of organisms can sustain a larger biomass at the next trophic level because the organisms reproduce rapidly and thus supply continuous nourishment. Energy pyramids, however, must always be upright because of the laws of thermodynamics. The first law of thermodynamics states that energy can neither be created nor destroyed; thus, each trophic level must acquire energy from the trophic level below. The second law of thermodynamics states that, during the transfer of energy, some energy is always lost as heat; thus, less energy is available at each higher trophic level.
Notification Switch
Would you like to follow the 'Bio 351 university of texas' conversation and receive update notifications?

|
|

|
|

|
|

|
|

|
|

|
|
|
|
|

|
|

|
|

|