

| << Chapter < Page | Chapter >> Page > |
| Figure 5. Filtering in the frequency domain. |
|---|
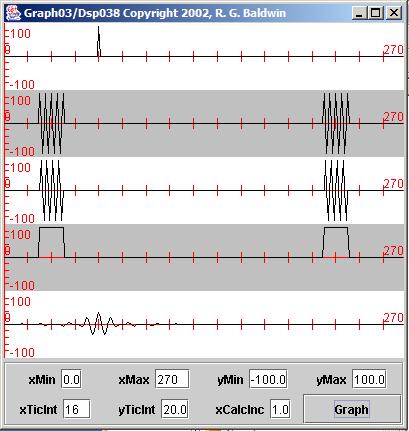 |
The basic plotting format of Figure 5 is the same as Figure 4 .
The first difference to note between the two figures is that I moved the impulse in the input time series in the topmost plot sixteen samples further tothe right in Dsp038 .
(This has no impact on the final result, which you can verify by modifying the program to move the impulse to a different position and thencompiling and running the modified program.)
The second difference to note is shown in the modified amplitude spectrum in the fourth plot in the two figures. The bandwidth of the pass band issignificantly narrower in Figure 5 than in Figure 4 . Also, the pass band in Figure 4 extends all the way down to zero frequency, while Figure 5 eliminates all energy below a frequency of three thirty-seconds of the sampling frequency.
Finally, note the waveforms of the two filtered impulses. The overall amplitude of the filtered impulse in Figure 5 is less than in Figure 4 , simply because it contains less total energy. In addition, the filtered impulse in Figure 5 is broader than the filtered impulse in Figure 4 . This is because it has a narrower bandwidth.
(Pulses that are narrow in terms of time duration require a wider bandwidth than pulses that have a longer time duration. The time duration ofthe pulse tends to be inversely related to the required bandwidth for the pulse.)
I encourage you to copy, compile, and run the programs provided in this module. Experiment with them, making changes and observing the results of yourchanges.
Create more complex experiments. For example, use more complex input time series when experimenting with frequency filtering. Apply differentmodifications to the complex spectrum when experimenting with frequency filtering.
Most of all enjoy yourself and learn something in the process.
This module illustrates and explains forward and inverse Fourier transforms using both DFT and FFT algorithms.
The module also illustrates and explains the implementation of frequency filtering by modifying the complex spectrum in the frequency domain and thentransforming the modified complex spectrum back into the time domain.
Complete listings of the programs discussed in this module are provided below.
Listings for other programs mentioned in the module, such as Graph03 and Graph06 , are provided in other modules. Those modules are identified in the text of this module.
| Listing 14. Dsp035.java. |
|---|
import java.util.*;

class Dsp035 implements GraphIntfc01{final double pi = Math.PI;

  int len = 256;double[] timeDataIn = new double[len];
  double[]realSpect = new double[len];double[] imagSpect = new double[len];
  double[]angle = new double[len];//unuseddouble[] magnitude = new double[len];
  double[]timeDataOut = new double[len];int zero = 0;

  public Dsp035(){//constructor//Create the raw data pulses
    timeDataIn[0]= 0;
    timeDataIn[1]= 50;
    timeDataIn[2]= 75;
    timeDataIn[3]= 80;
    timeDataIn[4]= 75;
    timeDataIn[5]= 50;
    timeDataIn[6]= 25;
    timeDataIn[7]= 0;
    timeDataIn[8]= -25;
    timeDataIn[9]= -50;
    timeDataIn[10]= -75;
    timeDataIn[11]= -80;
    timeDataIn[12]= -60;
    timeDataIn[13]= -40;
    timeDataIn[14]= -26;
    timeDataIn[15]= -17;
    timeDataIn[16]= -11;
    timeDataIn[17]= -8;
    timeDataIn[18]= -5;
    timeDataIn[19]= -3;
    timeDataIn[20]= -2;
    timeDataIn[21]= -1;

    timeDataIn[240]= 80;
    timeDataIn[241]= 80;
    timeDataIn[242]= 80;
    timeDataIn[243]= 80;
    timeDataIn[244]= -80;
    timeDataIn[245]= -80;
    timeDataIn[246]= -80;
    timeDataIn[247]= -80;
    timeDataIn[248]= 80;
    timeDataIn[249]= 80;
    timeDataIn[250]= 80;
    timeDataIn[251]= 80;
    timeDataIn[252]= -80;
    timeDataIn[253]= -80;
    timeDataIn[254]= -80;
    timeDataIn[255]= -80;

    //Create raw data sinusoidfor(int x = len/3;x<3*len/4;x++){
      timeDataIn[x]= 80.0 * Math.sin(
                              2*pi*(x)*1.0/20.0);}//end for loop

    //Compute DFT of the time data and save it in// the output arrays.
    ForwardRealToComplex01.transform(timeDataIn,realSpect,
                                     imagSpect,angle,
                                     magnitude,zero,
                                     0.0,1.0);

    //Compute inverse DFT of spectral data and// save output time data in output array
    InverseComplexToReal01.inverseTransform(realSpect,
                    imagSpect,timeDataOut);
  }//end constructor//-------------------------------------------//
  //The following six methods are required by the// interface named GraphIntfc01.
  public int getNmbr(){//Return number of curves to plot.  Must not
    // exceed 5.return 5;
  }//end getNmbr//-------------------------------------------//
  public double f1(double x){int index = (int)Math.round(x);
    if(index<0 || index>timeDataIn.length-1){
      return 0;}else{
      return timeDataIn[index];
    }//end else}//end function
  //-------------------------------------------//public double f2(double x){
    int index = (int)Math.round(x);if(index<0 || index>realSpect.length-1){
      return 0;}else{
      //scale for convenient viewingreturn 5*realSpect[index];}//end else
  }//end function//-------------------------------------------//
  public double f3(double x){int index = (int)Math.round(x);
    if(index<0 || index>imagSpect.length-1){
      return 0;}else{
      //scale for convenient viewingreturn 5*imagSpect[index];}//end else
  }//end function//-------------------------------------------//
  public double f4(double x){int index = (int)Math.round(x);
    if(index<0 || index>magnitude.length-1){
      return 0;}else{
      //scale for convenient viewingreturn 5*magnitude[index];}//end else
  }//end function//-------------------------------------------//
  public double f5(double x){int index = (int)Math.round(x);
    if(index<0 ||
                   index>timeDataOut.length-1){
      return 0;}else{
      return timeDataOut[index];
    }//end else}//end function

}//end sample class Dsp035 |
Notification Switch
Would you like to follow the 'Digital signal processing - dsp' conversation and receive update notifications?

|
|

|
|

|
|

|
|

|
|

|
|

|
|

|
|

|
|
|
|