

| << Chapter < Page | Chapter >> Page > |
The goodness–of–fit test can be used to decide whether a population fits a given distribution, but it will not suffice to decide whether two populations follow the same unknown distribution. A different test, called the test for homogeneity , can be used to draw a conclusion about whether two populations have the same distribution. To calculate the test statistic for a test for homogeneity, follow the same procedure as with the test of independence.
The expected value inside each cell needs to be at least five in order for you to use this test.
Do male and female college students have the same distribution of living arrangements? Use a level of significance of 0.05. Suppose that 250 randomly selected male college students and 300 randomly selected female college students were asked about their living arrangements: dormitory, apartment, with parents, other. The results are shown in [link] . Do male and female college students have the same distribution of living arrangements?
| Dormitory | Apartment | With Parents | Other | |
| Males | 72 | 84 | 49 | 45 |
| Females | 91 | 86 | 88 | 35 |
H
0 : The distribution of living arrangements for male college students is the same as the distribution of living arrangements for female college students.
H
a : The distribution of living arrangements for male college students is not the same as the distribution of living arrangements for female college students.
Degrees of Freedom (
df ):
df = number of columns – 1 = 4 – 1 = 3
Distribution for the test:
Calculate the test statistic:
= 10.129
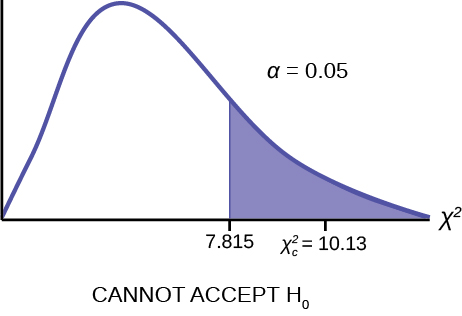
The graph of the Chi-square shows the distribution and marks the critical value with three degrees of freedom at 95% level of confidence, α = 0.05, 7.815. The graph also marks the calculated
χ
2 test statistic of 10.129. Comparing the test statistic with the critical value, as we have done with all other hypothesis tests, we reach the conclusion.
Make a decision: Because the calculated test statistic is in the tail we cannot accept
H
0 . This means that the distributions are not the same.
Conclusion: At a 5% level of significance, from the data, there is sufficient evidence to conclude that the distributions of living arrangements for male and female college students are not the same.
Notice that the conclusion is only that the distributions are not the same. We cannot use the test for homogeneity to draw any conclusions about how they differ.
Do families and singles have the same distribution of cars? Use a level of significance of 0.05. Suppose that 100 randomly selected families and 200 randomly selected singles were asked what type of car they drove: sport, sedan, hatchback, truck, van/SUV. The results are shown in [link] . Do families and singles have the same distribution of cars? Test at a level of significance of 0.05.
| Sport | Sedan | Hatchback | Truck | Van/SUV | |
|---|---|---|---|---|---|
| Family | 5 | 15 | 35 | 17 | 28 |
| Single | 45 | 65 | 37 | 46 | 7 |
With a p -value of almost zero, we reject the null hypothesis. The data show that the distribution of cars is not the same for families and singles.
Ivy League schools receive many applications, but only some can be accepted. At the schools listed in [link] , two types of applications are accepted: regular and early decision.
| Application Type Accepted | Brown | Columbia | Cornell | Dartmouth | Penn | Yale |
|---|---|---|---|---|---|---|
| Regular | 2,115 | 1,792 | 5,306 | 1,734 | 2,685 | 1,245 |
| Early Decision | 577 | 627 | 1,228 | 444 | 1,195 | 761 |
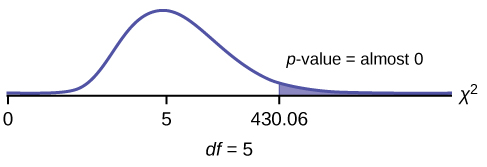
We want to know if the number of regular applications accepted follows the same distribution as the number of early applications accepted. State the null and alternative hypotheses, the degrees of freedom and the test statistic, sketch the graph of the χ 2 distribution and show the critical value and the calculated value of the test statistic, and draw a conclusion about the test of homogeneity.
H 0 : The distribution of regular applications accepted is the same as the distribution of early applications accepted.
H
a : The distribution of regular applications accepted is not the same as the distribution of early applications accepted.
df = 5
χ
2 test statistic = 430.06
Press the
MATRX key and arrow over to
EDIT . Press
1:[A] . Press
3 ENTER 3 ENTER . Enter the table values by row. Press
ENTER after each. Press
2nd QUIT . Press
STAT and arrow over to
TESTS . Arrow down to
C:χ2-TEST . Press
ENTER . You should see
Observed:[A] and Expected:[B] . Arrow down to
Calculate . Press
ENTER . The test statistic is 430.06 and the
p -value = 9.80E-91. Do the procedure a second time but arrow down to
Draw instead of
calculate .
Data from the Insurance Institute for Highway Safety, 2013. Available online at www.iihs.org/iihs/ratings (accessed May 24, 2013).
“Energy use (kg of oil equivalent per capita).” The World Bank, 2013. Available online at http://data.worldbank.org/indicator/EG.USE.PCAP.KG.OE/countries (accessed May 24, 2013).
“Parent and Family Involvement Survey of 2007 National Household Education Survey Program (NHES),” U.S. Department of Education, National Center for Education Statistics. Available online at http://nces.ed.gov/pubsearch/pubsinfo.asp?pubid=2009030 (accessed May 24, 2013).
“Parent and Family Involvement Survey of 2007 National Household Education Survey Program (NHES),” U.S. Department of Education, National Center for Education Statistics. Available online at http://nces.ed.gov/pubs2009/2009030_sup.pdf (accessed May 24, 2013).
To assess whether two data sets are derived from the same distribution—which need not be known, you can apply the test for homogeneity that uses the chi-square distribution. The null hypothesis for this test states that the populations of the two data sets come from the same distribution. The test compares the observed values against the expected values if the two populations followed the same distribution. The test is right-tailed. Each observation or cell category must have an expected value of at least five.
Homogeneity test statistic where:
O = observed values
E = expected values
i = number of rows in data contingency table
j = number of columns in data contingency table
df = ( i −1)( j −1) Degrees of freedom
A math teacher wants to see if two of her classes have the same distribution of test scores. What test should she use?
test for homogeneity
What are the null and alternative hypotheses for [link] ?
A market researcher wants to see if two different stores have the same distribution of sales throughout the year. What type of test should he use?
test for homogeneity
A meteorologist wants to know if East and West Australia have the same distribution of storms. What type of test should she use?
What condition must be met to use the test for homogeneity?
All values in the table must be greater than or equal to five.
Use the following information to answer the next five exercises: Do private practice doctors and hospital doctors have the same distribution of working hours? Suppose that a sample of 100 private practice doctors and 150 hospital doctors are selected at random and asked about the number of hours a week they work. The results are shown in [link] .
| 20–30 | 30–40 | 40–50 | 50–60 | |
|---|---|---|---|---|
| Private Practice | 16 | 40 | 38 | 6 |
| Hospital | 8 | 44 | 59 | 39 |
State the null and alternative hypotheses.
df = _______
3
What is the test statistic?
What can you conclude at the 5% significance level?
Notification Switch
Would you like to follow the 'Introductory statistics' conversation and receive update notifications?

|
|

|
|

|
|

|
|

|
|

|
|

|
|

|
|

|
|
|
|