

| << Chapter < Page | Chapter >> Page > |
A college football coach was interested in whether the college's strength development class increased his players' maximum lift (in pounds) on the bench press exercise. He asked four of his players to participate in a study. The amount of weight they could each lift was recorded before they took the strength development class. After completing the class, the amount of weight they could each lift was again measured. The data are as follows:
| Weight (in pounds) | Player 1 | Player 2 | Player 3 | Player 4 |
|---|---|---|---|---|
| Amount of weight lifted prior to the class | 205 | 241 | 338 | 368 |
| Amount of weight lifted after the class | 295 | 252 | 330 | 360 |
The coach wants to know if the strength development class makes his players stronger, on average.
Record the
differences data. Calculate the differences by subtracting the amount of weight lifted prior to the class from the weight lifted after completing the class. The data for the differences are: {90, 11, -8, -8}. Assume the differences have a normal distribution.
= 21.3, s d = 46.7
Using the difference data, this becomes a test of a single __________ (fill in the blank).
Define the random variable: mean difference in the maximum lift per player.
The distribution for the hypothesis test is a student's t with 3 degrees of freedom.
H 0 : μ d ≤ 0, H a : μ d >0
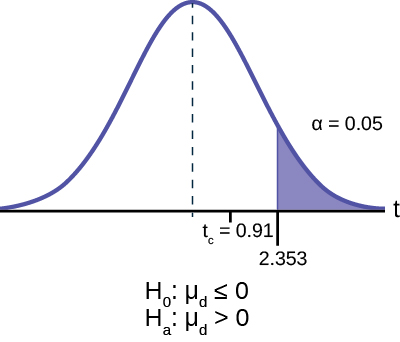
Calculate the test statistic look up the critical value: Critical value of the student's t at 5% level of significant and 3 degrees of freedom are 2.353 and 0.91, respectively.
Decision: If the level of significance is 5%, we cannot reject the null hypothesis, because the calculated value of the test statistic is not in the tail.
What is the conclusion?
At a 5% level of significance, from the sample data, there is not sufficient evidence to conclude that the strength development class helped to make the players stronger, on average.
A new prep class was designed to improve SAT test scores. Five students were selected at random. Their scores on two practice exams were recorded, one before the class and one after. The data recorded in [link] . Are the scores, on average, higher after the class? Test at a 5% level.
| SAT Scores | Student 1 | Student 2 | Student 3 | Student 4 |
|---|---|---|---|---|
| Score before class | 1840 | 1960 | 1920 | 2150 |
| Score after class | 1920 | 2160 | 2200 | 2100 |
The p -value is 0.0874, so we decline to reject the null hypothesis. The data do not support that the class improves SAT scores significantly.
Five ball players think they can throw the same distance with their dominant hand (throwing) and off-hand (catching hand). The data were collected and recorded in [link] . Conduct a hypothesis test to determine whether the mean difference in distances between the dominant and off-hand is significant. Test at the 5% level.
| Player 1 | Player 2 | Player 3 | Player 4 | Player 5 | |
|---|---|---|---|---|---|
| Dominant Hand | 120 | 111 | 135 | 140 | 125 |
| Off-hand | 105 | 109 | 98 | 111 | 99 |
The p -level is 0.0230, so we can reject the null hypothesis. The data show that the players do not throw the same distance with their off-hands as they do with their dominant hands.
A hypothesis test for matched or paired samples (t-test) has these characteristics:
Notification Switch
Would you like to follow the 'Introductory statistics' conversation and receive update notifications?

|
|

|
|
|
|
|

|
|
|
|
|

|
|

|
|

|
|

|
|

|