<< Chapter < Page Chapter >> Page >

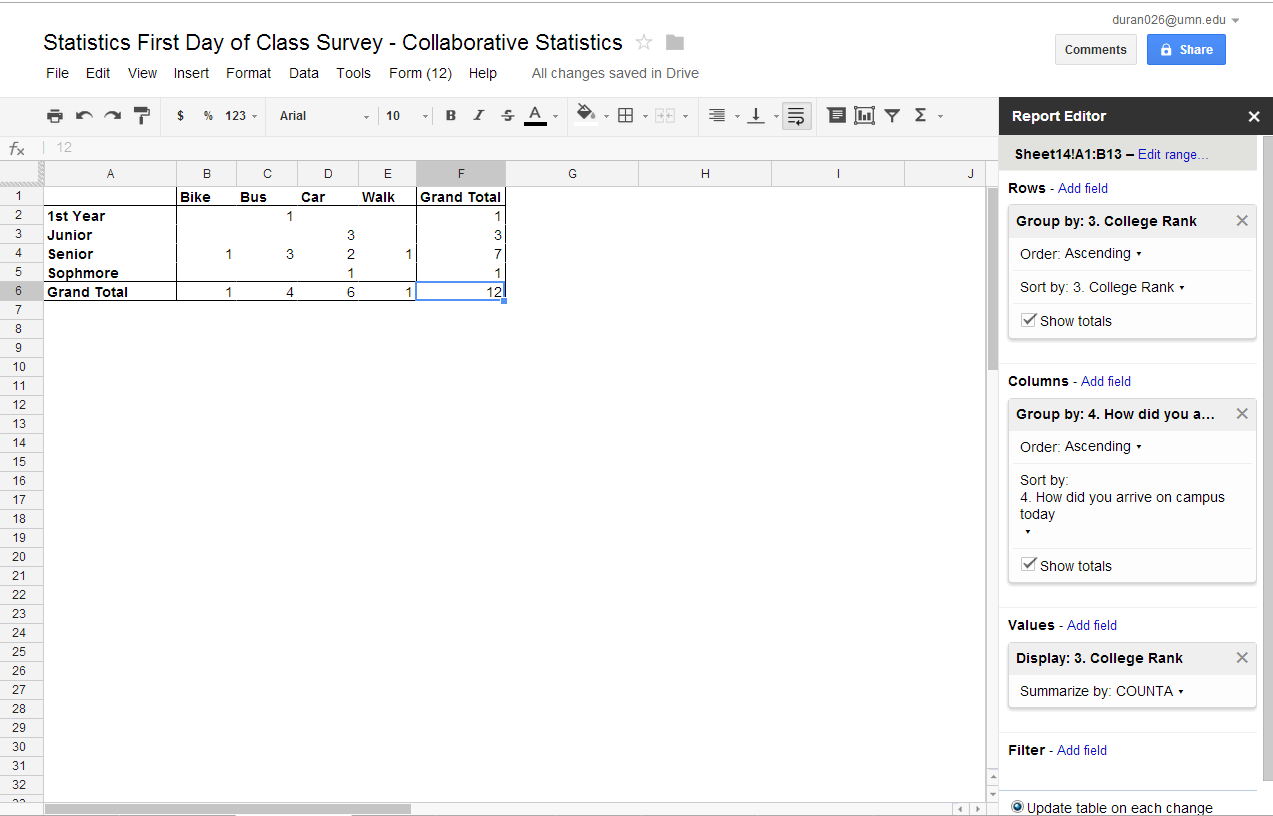
Google Spreadsheet – You can create pivot tables in Google Spreadsheet as you did for univariate data however you have the same limitations, you cannot create row or column percentages unless you create them using formula (which you can do!) The only difference here is that you will again highlight two columns of data that you want to look at in the pivot table and select one for the rows and one for the columns. See the image below. Go back to Sampling and Data to get more details on how to find the Report Editor.

Bar graphs (stacked and side by side):

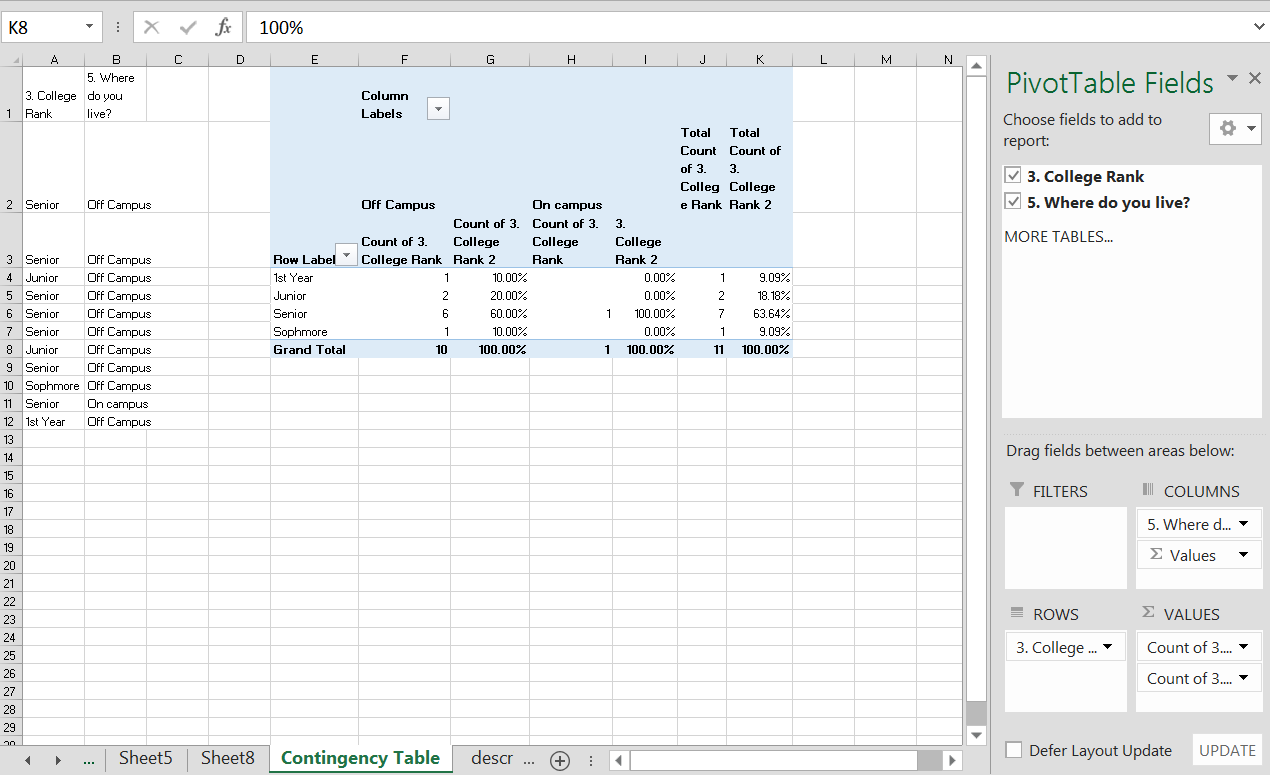
In both Excel and Google Spreadsheet, it is very easy to create side by side or stacked bar graphs directly from your contingency tables. Highlight the fields on your contingency table (note do not highlight the totals column or any of the cell highlighted “blue”) and then go to your insert tab and insert a chart. See the fields highlighted (the area highlighted grey with a green border around it) in the figure below.

You have a choice of side by side or stacked. In Excel you can use your percentages. In Google Spreadsheet you will need to create your percentages if you want them in your bar graphs. Below is output from Excel and Google Spreadsheet. Both spreadsheet programs give you many options in the design and format modes. In Excel you can access the design you want from the Change Chart Type field on the Design Tab. In Google Spreadsheet you change chart types in the Chart editor under the start tab or the charts tab. Explore . . . it’s fun.

Pie charts:

Pie charts are created the same way as bar graphs in Excel and in Google Spreadsheets using the pivot table . . . however you will need to change the order of the columns to create multiple pie charts. If you use the sort function in the PivotTable field (highlighted in green below) the field at the top of the PivotChart Fields, mouse over the down arrow, a popup menu will appear, pick a different sort option (a to z, z to a, or more sort options), and then the order of your columns will change. See Image of the popup menu below.

To make multiple pie charts you will need to copy the pie chart as a picture and paste it on your spreadsheet before you pick an alternative sort method. If you do not copy the pie chart as a picture, when you sort the data, you graph will change (it remains dynamic). Same is true when creating pie charts in Google Spreadsheet.

Optional classroom exercise for categorical –categorical data:

At your computer, try this exercise: (1) Open the file, Statistics First Day of Class Survey that you worked on previously (2) open the file in Google Spreadsheet or Excel; (3) create a new worksheet tab and label it Bivariate Graphs for Categorical Data; (4) pick two column of data that are categorical and has been “cleaned” and create a contingency table, side by side bar graphs and side by side pie graphs with all the appropriate labels; And (5) save the file again and post in the appropriate Moodle assignment.

Categorical - numerical

When working with categorical and numerical data and Excel or Google Spreadsheet, one of the best first steps is again, to copy the columns of data from your working data sheet to a new spreadsheet, and label the spreadsheet. The next step will be to sort the data. You must be sure to sort both columns of data together. The data from the categorical column and the numerical column are related. They are a pair of data from the same source. In examining categorical – numerical data we want to know what is the relationship between the two responses, so we must keep the two columns together.

Questions & Answers

how does Neisseria cause meningitis
Nyibol Reply
what is microbiologist
Muhammad Reply
what is errata
Muhammad
is the branch of biology that deals with the study of microorganisms.
Ntefuni Reply
What is microbiology
Mercy Reply
studies of microbes
Louisiaste
when we takee the specimen which lumbar,spin,
Ziyad Reply
How bacteria create energy to survive?
Muhamad Reply
Bacteria doesn't produce energy they are dependent upon their substrate in case of lack of nutrients they are able to make spores which helps them to sustain in harsh environments
_Adnan
But not all bacteria make spores, l mean Eukaryotic cells have Mitochondria which acts as powerhouse for them, since bacteria don't have it, what is the substitution for it?
Muhamad
they make spores
Louisiaste
what is sporadic nd endemic, epidemic
Aminu Reply
the significance of food webs for disease transmission
Abreham
food webs brings about an infection as an individual depends on number of diseased foods or carriers dully.
Mark
explain assimilatory nitrate reduction
Esinniobiwa Reply
Assimilatory nitrate reduction is a process that occurs in some microorganisms, such as bacteria and archaea, in which nitrate (NO3-) is reduced to nitrite (NO2-), and then further reduced to ammonia (NH3).
Elkana
This process is called assimilatory nitrate reduction because the nitrogen that is produced is incorporated in the cells of microorganisms where it can be used in the synthesis of amino acids and other nitrogen products
Elkana
Examples of thermophilic organisms
Shu Reply
Give Examples of thermophilic organisms
Shu
advantages of normal Flora to the host
Micheal Reply
Prevent foreign microbes to the host
Abubakar
they provide healthier benefits to their hosts
ayesha
They are friends to host only when Host immune system is strong and become enemies when the host immune system is weakened . very bad relationship!
Mark
what is cell
faisal Reply
cell is the smallest unit of life
Fauziya
cell is the smallest unit of life
Akanni
ok
Innocent
cell is the structural and functional unit of life
Hasan
is the fundamental units of Life
Musa
what are emergency diseases
Micheal Reply
There are nothing like emergency disease but there are some common medical emergency which can occur simultaneously like Bleeding,heart attack,Breathing difficulties,severe pain heart stock.Hope you will get my point .Have a nice day ❣️
_Adnan
define infection ,prevention and control
Innocent
I think infection prevention and control is the avoidance of all things we do that gives out break of infections and promotion of health practices that promote life
Lubega
Heyy Lubega hussein where are u from?
_Adnan
en français
Adama
which site have a normal flora
ESTHER Reply
Many sites of the body have it Skin Nasal cavity Oral cavity Gastro intestinal tract
Safaa
skin
Asiina
skin,Oral,Nasal,GIt
Sadik
How can Commensal can Bacteria change into pathogen?
Sadik
How can Commensal Bacteria change into pathogen?
Sadik
all
Tesfaye
by fussion
Asiina
what are the advantages of normal Flora to the host
Micheal
what are the ways of control and prevention of nosocomial infection in the hospital
Micheal
what is inflammation
Shelly Reply
part of a tissue or an organ being wounded or bruised.
Wilfred
what term is used to name and classify microorganisms?
Micheal Reply
Binomial nomenclature
adeolu
Got questions? Join the online conversation and get instant answers!
Jobilize.com Reply

Get Jobilize Job Search Mobile App in your pocket Now!

Get it on Google Play Download on the App Store Now


Source:  OpenStax, Collaborative statistics using spreadsheets. OpenStax CNX. Jan 05, 2016 Download for free at http://legacy.cnx.org/content/col11521/1.23
Google Play and the Google Play logo are trademarks of Google Inc.

Notification Switch

Would you like to follow the 'Collaborative statistics using spreadsheets' conversation and receive update notifications?

Ask