

| << Chapter < Page | Chapter >> Page > |
This case draws a sinusoidal surface along the horizontal axis with one sample per cycle.
(This surface is under sampled by a factor of two under the commonly held belief that there should be at least two samples per cycle of the highestfrequency component in the surface.)
Thus, it is impossible to distinguish this surface from a surface consisting of a sinusoid with a frequency of zero.
The code that was used to produce this surface is shown in Listing 19 . This code is typical of the code that I will be using to produce the remainingsurfaces in this module. This code is straightforward and shouldn't require further explanation.
| Listing 19. Code for Case 8. |
|---|
case 8:
        for(int row = 0; row<rows; row++){
          for(int col = 0; col<cols; col++){
            spatialData[row][col] =cos(2*PI*col/1);
          }//end inner loop}//end outer loop
break; |
The Fourier transform of this surface produces a single peak at the origin in the wavenumber spectrum just like in Figure 12 . I didn't provide a display of the graphic output for this case because it looks just like the graphic outputshown for the zero frequency sinusoid in Figure 12 .
This case draws a sinusoidal surface along the horizontal axis with two samples per cycle as shown in the leftmost image in Figure 13 . This corresponds to the Nyquist folding wavenumber.
The center image in Figure 13 shows the wavenumber amplitude spectrum for this surface. The wavenumber spectrum has white peak values at the positive andnegative folding wave numbers on the right and left edges of the imaged. The colors in between these two peaks are green, blue, and gray indicating very low values.
| Figure 13. Graphic output for Case 9. |
|---|
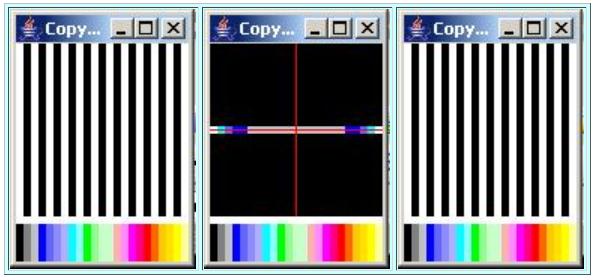 |
The output from the inverse Fourier transform performed on the complex wavenumber spectrum for this case is shown in the rightmost image in Figure 13 . The output is a good match for the input shown on the left.
You can view the code that was used to create this surface in Listing 22 near the end of the module.
This case draws a sinusoidal surface along the vertical axis with two samples per cycle. Again, this is the Nyquist folding wave number but the sinusoidappears along the vertical axis instead of appearing along the horizontal axis. If you run this case and view the results, you will see that it replicates theresults from Case 9 except that everything is rotated by ninety degrees in both the space domain and the wavenumber domain.
This case draws a sinusoidal surface along the horizontal axis with eight samples per cycle as shown in the leftmost image of Figure 14 .
| Figure 14. Graphic output for Case 11. |
|---|
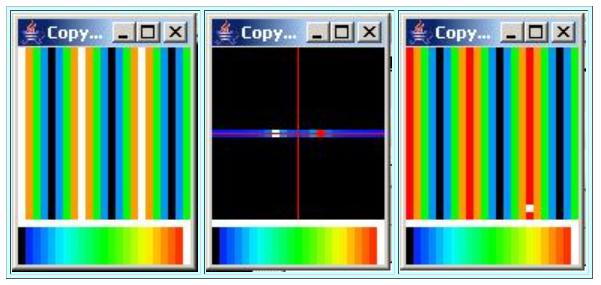 |
Performing a forward Fourier transform on this surface produces symmetrical peaks on the horizontal axis on either side of the wavenumber origin. The twopeaks are indicated by the small white and red squares on the horizontal axis in the center image in Figure 14 .
Notification Switch
Would you like to follow the 'Digital signal processing - dsp' conversation and receive update notifications?

|
|

|
|

|
|

|
|

|
|

|
|
|
|
|

|
|

|
|

|