<< Chapter < Page Chapter >> Page >

Solution for Remaining Times

The procedures for calculating the position and velocity at t = 2 . 00 s size 12{t=2 "." "00"`s} {} and 3 . 00 s size 12{3 "." "00 s"} {} are the same as those above. The results are summarized in [link] and illustrated in [link] .

Results
Time, t Position, y Velocity, v Acceleration, a
1 . 00 s size 12{1 "." "00 s"} {} 8 . 10 m size 12{8 "." "10 m"} {} 3 . 20 m/s size 12{3 "." "20 m/s"} {} 9 . 80 m/s 2 size 12{-9 "." "80 m/s" rSup { size 8{2} } } {}
2 . 00 s size 12{2 "." "00 s"} {} 6 . 40 m size 12{6 "." "40 m"} {} 6 . 60 m/s size 12{ - 6 "." "60 m/s"} {} 9 . 80 m/s 2 size 12{-9 "." "80 m/s" rSup { size 8{2} } } {}
3 . 00 s size 12{3 "." "00 s"} {} 5 . 10 m size 12{ - 5 "." "10 m"} {} 16 . 4 m/s size 12{ - "16" "." "4 m/s"} {} 9 . 80 m/s 2 size 12{-9 "." "80 m/s" rSup { size 8{2} } } {}

Graphing the data helps us understand it more clearly.
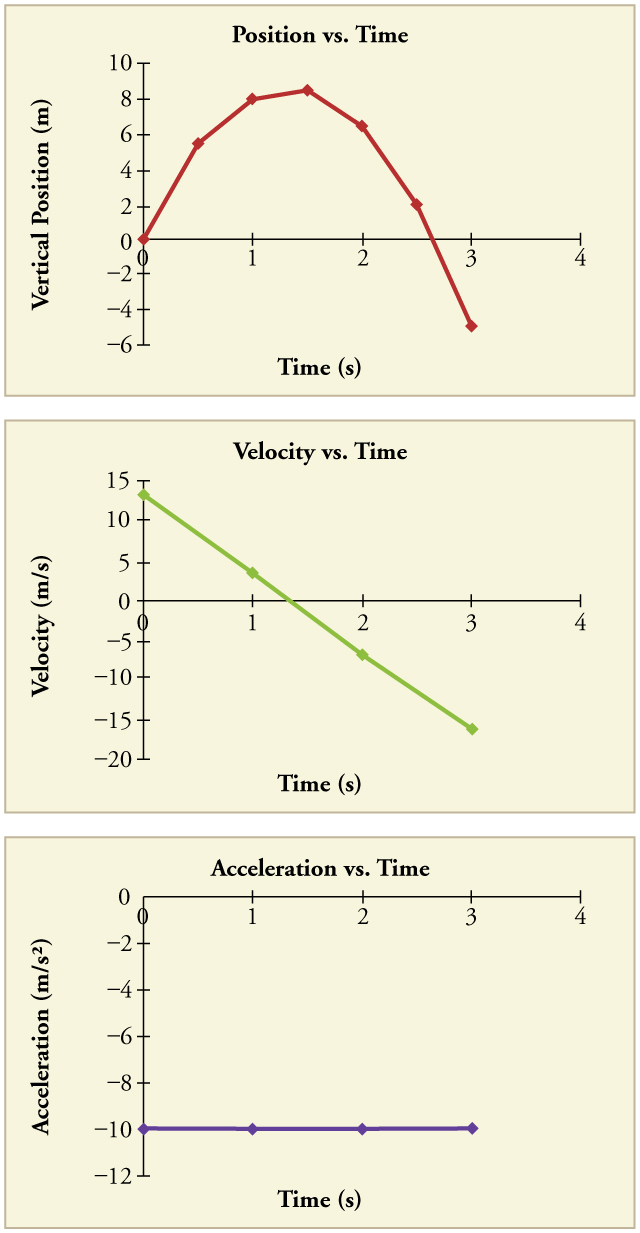
Three panels showing three graphs. The top panel shows a graph of vertical position in meters versus time in seconds. The line begins at the origin and has a positive slope that decreases over time until it hits a turning point between seconds 1 and 2. After that it has a negative slope that increases over time. The middle panel shows a graph of velocity in meters per second versus time in seconds. The line is straight, with a negative slope, beginning at time zero velocity of thirteen meters per second and ending at time 3 seconds with a velocity just over negative sixteen meters per second. The bottom panel shows a graph of acceleration in meters per second squared versus time in seconds. The line is straight and flat at a y value of negative 9 point 80 meters per second squared from time 0 to time 3 seconds.
Vertical position, vertical velocity, and vertical acceleration vs. time for a rock thrown vertically up at the edge of a cliff. Notice that velocity changes linearly with time and that acceleration is constant. Misconception Alert! Notice that the position vs. time graph shows vertical position only. It is easy to get the impression that the graph shows some horizontal motion—the shape of the graph looks like the path of a projectile. But this is not the case; the horizontal axis is time , not space. The actual path of the rock in space is straight up, and straight down.

Discussion

The interpretation of these results is important. At 1.00 s the rock is above its starting point and heading upward, since y 1 size 12{y rSub { size 8{1} } } {} and v 1 size 12{v rSub { size 8{1} } } {} are both positive. At 2.00 s, the rock is still above its starting point, but the negative velocity means it is moving downward. At 3.00 s, both y 3 size 12{y rSub { size 8{3} } } {} and v 3 size 12{v rSub { size 8{3} } } {} are negative, meaning the rock is below its starting point and continuing to move downward. Notice that when the rock is at its highest point (at 1.5 s), its velocity is zero, but its acceleration is still 9 . 80 m/s 2 size 12{-9 "." "80 m/s" rSup { size 8{2} } } {} . Its acceleration is 9 . 80 m/s 2 size 12{-9 "." "80 m/s" rSup { size 8{2} } } {} for the whole trip—while it is moving up and while it is moving down. Note that the values for y size 12{y} {} are the positions (or displacements) of the rock, not the total distances traveled. Finally, note that free-fall applies to upward motion as well as downward. Both have the same acceleration—the acceleration due to gravity, which remains constant the entire time. Astronauts training in the famous Vomit Comet, for example, experience free-fall while arcing up as well as down, as we will discuss in more detail later.

Calculating velocity of a falling object: a rock thrown down

What happens if the person on the cliff throws the rock straight down, instead of straight up? To explore this question, calculate the velocity of the rock when it is 5.10 m below the starting point, and has been thrown downward with an initial speed of 13.0 m/s.

Strategy

Draw a sketch.

Velocity vector arrow pointing down in the negative y direction and labeled v sub zero equals negative thirteen point 0 meters per second. Acceleration vector arrow also pointing down in the negative y direction, labeled a equals negative 9 point 80 meters per second squared.

Since up is positive, the final position of the rock will be negative because it finishes below the starting point at y 0 = 0 size 12{y rSub { size 8{0} } =0} {} . Similarly, the initial velocity is downward and therefore negative, as is the acceleration due to gravity. We expect the final velocity to be negative since the rock will continue to move downward.

Solution

1. Identify the knowns. y 0 = 0 ; y 1 = 5 . 10 m ; v 0 = 13 .0 m/s ; a = g = 9 . 80 m /s 2 size 12{a= - g= - 9 "." "80"" m/s" rSup { size 8{2} } } {} .

2. Choose the kinematic equation that makes it easiest to solve the problem. The equation v 2 = v 0 2 + 2 a ( y y 0 ) works well because the only unknown in it is v . (We will plug y 1 in for y .)

3. Enter the known values

v 2 = 13 . 0 m/s 2 + 2 9 . 80 m/s 2 5 . 10 m 0 m = 268 . 96 m 2 /s 2 , size 12{v rSup { size 8{2} } = left ( - "13" "." "0 m/s" right ) rSup { size 8{2} } +2 left ( - 9 "." "80 m/s" rSup { size 8{2} } right ) left ( - 5 "." "10 m" - "0 m" right )="268" "." "96 m" rSup { size 8{2} } "/s" rSup { size 8{2} } } {}
Practice Key Terms 2

Get Jobilize Job Search Mobile App in your pocket Now!

Get it on Google Play Download on the App Store Now


Source:  OpenStax, Kinematics. OpenStax CNX. Sep 11, 2015 Download for free at https://legacy.cnx.org/content/col11878/1.5
Google Play and the Google Play logo are trademarks of Google Inc.

Notification Switch

Would you like to follow the 'Kinematics' conversation and receive update notifications?

Ask