Always take note of the unit in which the answer must be given – this will usually be m² or km².
ACTIVITY 1: [LO 1.3]
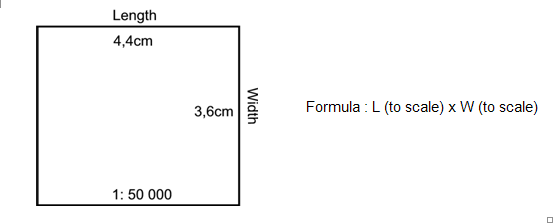
The length of a rectangular object is 5,6 cm and the width is 3,4 cm on a 1 : 50 000 topographic map. Calculate the area of the object in km².
The length of a building is 1,1 cm and the width is 0,6 cm on a 1 : 50 000 topographic map. Calculate the area of the building in m².Calculating time between 2 points.
Remember the following:
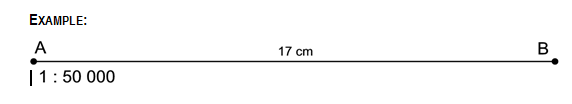
The distance completed will have to be calculated from the map and be given in real km. Speed or time will always be provided.
How long will it take to travel by car at 60 km/h from point A to point B?
Steps:
ACTIVITY 2: [LO 1.3]
At what time will a person arrive at a destination if he or she leaves the house at 7:00 and travels a distance shown as 8 cm on a 1 : 50 000 map? Reading and analysing maps
Topographic maps are among the most useful and precise maps that are available because of the amount of detail that they contain and the precision with which the minutest details are indicated.
Topographic maps and orthophoto maps provide the geographer’s tools (SOURCE) and the reader needs to understand the language of the map. This makes it possible to give scientific explanations of features.
The activities that follow will help the learner to master map-reading techniques and skills and to extend his or her knowledge of Bloemfontein.
ACTIVITY 3: [LO 1.7]
Consult your atlas to answer the following questions:
Find out where Bloemfontein is situated by using the index at the back of the atlas.
In which province of South Africa is Bloemfontein?
Indicate the direction to Durban from Bloemfontein.
Measure the distance between Edenburg (south of Bloemfontein) and Bloemfontein in km, using the linear scale given for the map in your atlas.
At what time will a bus arrive in Bloemfontein if it leaves Edenburg at 10:00 and travels at an average speed of 120 km/h, without stopping along the way?
Read the accompanying text and answer the questions dealing with Bloemfontein’s past.
Provide reasons for the city’s:
origin;
development as a city.
The development of Bloemfontein
More that a hundred years ago, trekkers from the Cape settled in the environment of Bloemfontein, which quickly developed into a centre for trading. In 1846, the location of the present city was selected by Major Warden as the most convenient site for building a fort and a residential area. From this beginning, and in spite of setbacks resulting from unrest and wars, which inhibited its development, the small town developed into an attractive city.
Bloemfontein forms the geographical hub of South Africa’s railway, road and airline services. The development of the Free State gold mines, less than 160 km from the city, has brought additional prosperity to the city, which is fast becoming an important industrial centre.
The city is situated in a picturesque environment in the heart of the Free State plateau, surrounded by hillocks and hills rising high above the plains. To the north is Naval Hill, from where there is a particularly beautiful view of the city.
Questions & Answers
differentiate between demand and supply
giving examples
In economics, a perfect market refers to a theoretical construct where all participants have perfect information, goods are homogenous, there are no barriers to entry or exit, and prices are determined solely by supply and demand. It's an idealized model used for analysis,
When MP₁ becomes negative, TP start to decline.
Extuples Suppose that the short-run production function of certain cut-flower firm is given by: Q=4KL-0.6K2 - 0.112 •
Where is quantity of cut flower produced, I is labour input and K is fixed capital input (K-5). Determine the average product of lab
Kelo
Extuples Suppose that the short-run production function of certain cut-flower firm is given by: Q=4KL-0.6K2 - 0.112 •
Where is quantity of cut flower produced, I is labour input and K is fixed capital input (K-5). Determine the average product of labour (APL) and marginal product of labour (MPL)
Quantity demanded refers to the specific amount of a good or service that consumers are willing and able to purchase at a give price and within a specific time period. Demand, on the other hand, is a broader concept that encompasses the entire relationship between price and quantity demanded
Ezea
ok
Shukri
how do you save a country economic situation when it's falling apart
Economic growth as an increase in the production and consumption of goods and services within an economy.but
Economic development as a broader concept that encompasses not only economic growth but also social & human well being.
Shukri
production function means
Jabir
What do you think is more important to focus on when considering inequality ?
sir...I just want to ask one question... Define the term contract curve? if you are free please help me to find this answer 🙏
Asui
it is a curve that we get after connecting the pareto optimal combinations of two consumers after their mutually beneficial trade offs
Awais
thank you so much 👍 sir
Asui
In economics, the contract curve refers to the set of points in an Edgeworth box diagram where both parties involved in a trade cannot be made better off without making one of them worse off. It represents the Pareto efficient allocations of goods between two individuals or entities, where neither p
Cornelius
In economics, the contract curve refers to the set of points in an Edgeworth box diagram where both parties involved in a trade cannot be made better off without making one of them worse off. It represents the Pareto efficient allocations of goods between two individuals or entities,
Cornelius
Suppose a consumer consuming two commodities X and Y has
The following utility function u=X0.4 Y0.6. If the price of the X and Y are 2 and 3 respectively and income Constraint is birr 50.
A,Calculate quantities of x and y which maximize utility.
B,Calculate value of Lagrange multiplier.
C,Calculate quantities of X and Y consumed with a given price.
D,alculate optimum level of output .
the market for lemon has 10 potential consumers, each having an individual demand curve p=101-10Qi, where p is price in dollar's per cup and Qi is the number of cups demanded per week by the i th consumer.Find the market demand curve using algebra. Draw an individual demand curve and the market dema
suppose the production function is given by ( L, K)=L¼K¾.assuming capital is fixed find APL and MPL. consider the following short run production function:Q=6L²-0.4L³ a) find the value of L that maximizes output b)find the value of L that maximizes marginal product