-
Home
- Statistics i - math1020 - red
- Descriptive statistics
- Measures of the spread of the
Bringing it together
Twenty-five randomly selected students were asked the number of movies they watched the previous week. The results are as follows:
| # of movies |
Frequency |
| 0 |
5 |
| 1 |
9 |
| 2 |
6 |
| 3 |
4 |
| 4 |
1 |
- Find the sample mean
.
- Find the approximate sample standard deviation,
s .
Forty randomly selected students were asked the number of pairs of sneakers they owned. Let
X = the number of pairs of sneakers owned. The results are as follows:
|
X |
Frequency |
| 1 |
2 |
| 2 |
5 |
| 3 |
8 |
| 4 |
12 |
| 5 |
12 |
| 6 |
0 |
| 7 |
1 |
- Find the sample mean
- Find the sample standard deviation,
s
- Construct a histogram of the data.
- Complete the columns of the chart.
- Find the first quartile.
- Find the median.
- Find the third quartile.
- Construct a box plot of the data.
- What percent of the students owned at least five pairs?
- Find the 40
th percentile.
- Find the 90
th percentile.
- Construct a line graph of the data
- Construct a stemplot of the data
Following are the published weights (in pounds) of all of the team members of the San Francisco 49ers from a previous year.
177; 205; 210; 210; 232; 205; 185; 185; 178; 210; 206; 212; 184; 174; 185; 242; 188; 212; 215; 247; 241; 223; 220; 260; 245; 259; 278; 270; 280; 295; 275; 285; 290; 272; 273; 280; 285; 286; 200; 215; 185; 230; 250; 241; 190; 260; 250; 302; 265; 290; 276; 228; 265
- Organize the data from smallest to largest value.
- Find the median.
- Find the first quartile.
- Find the third quartile.
- Construct a box plot of the data.
- The middle 50% of the weights are from _______ to _______.
- If our population were all professional football players, would the above data be a sample of weights or the population of weights? Why?
- If our population included every team member who ever played for the San Francisco 49ers, would the above data be a sample of weights or the population of weights? Why?
- Assume the population was the San Francisco 49ers. Find:
- the population mean,
μ .
- the population standard deviation,
σ .
- the weight that is two standard deviations below the mean.
- When Steve Young, quarterback, played football, he weighed 205 pounds. How many standard deviations above or below the mean was he?
- That same year, the mean weight for the Dallas Cowboys was 240.08 pounds with a standard deviation of 44.38 pounds. Emmit Smith weighed in at 209 pounds. With respect to his team, who was lighter, Smith or Young? How did you determine your answer?
- 174; 177; 178; 184; 185; 185; 185; 185; 188; 190; 200; 205; 205; 206; 210; 210; 210; 212; 212; 215; 215; 220; 223; 228; 230; 232; 241; 241; 242; 245; 247; 250; 250; 259; 260; 260; 265; 265; 270; 272; 273; 275; 276; 278; 280; 280; 285; 285; 286; 290; 290; 295; 302
- 241
- 205.5
- 272.5
-
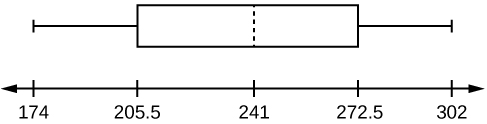
- 205.5, 272.5
- sample
- population
-
- 236.34
- 37.50
- 161.34
- 0.84 std. dev. below the mean
- Young
One hundred teachers attended a seminar on mathematical problem solving. The attitudes of a representative sample of 12 of the teachers were measured before and after the seminar. A positive number for change in attitude indicates that a teacher's attitude toward math became more positive. The 12 change scores are as follows:
- 3
- 8
- –1
- 2
- 0
- 5
- –3
- 1
- –1
- 6
- 5
- –2
- What is the mean change score?
- What is the standard deviation for this population?
- What is the median change score?
- Find the change score that is 2.2 standard deviations below the mean.
Source:
OpenStax, Statistics i - math1020 - red river college - version 2015 revision a - draft 2015-10-24. OpenStax CNX. Oct 24, 2015 Download for free at http://legacy.cnx.org/content/col11891/1.8
Google Play and the Google Play logo are trademarks of Google Inc.


