

| << Chapter < Page | Chapter >> Page > |
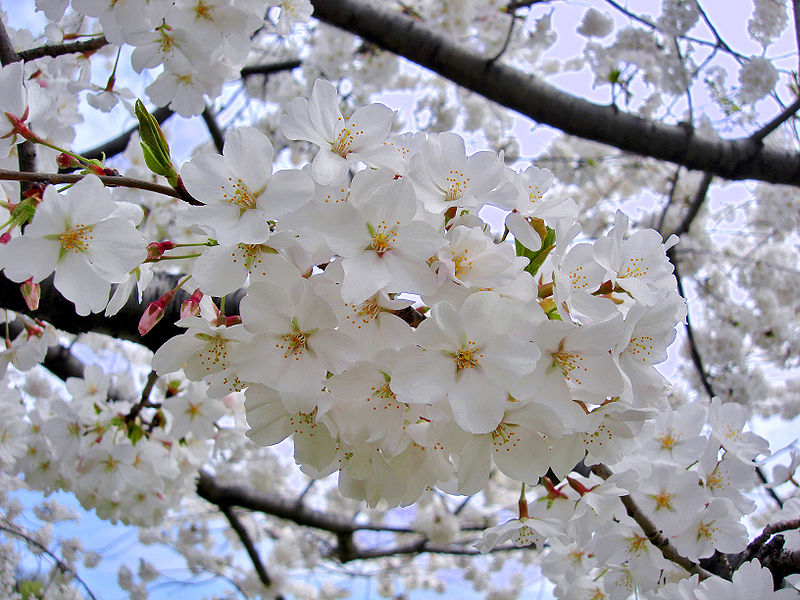
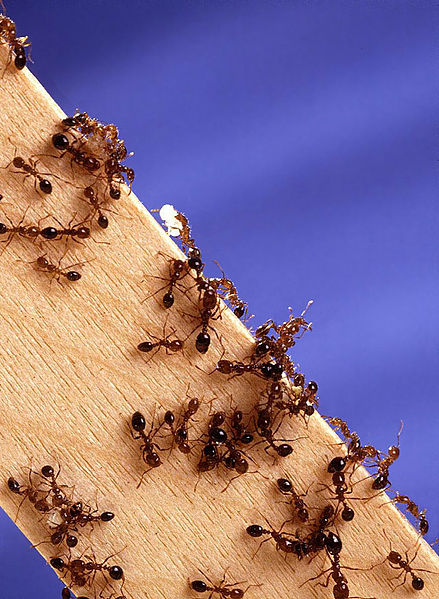
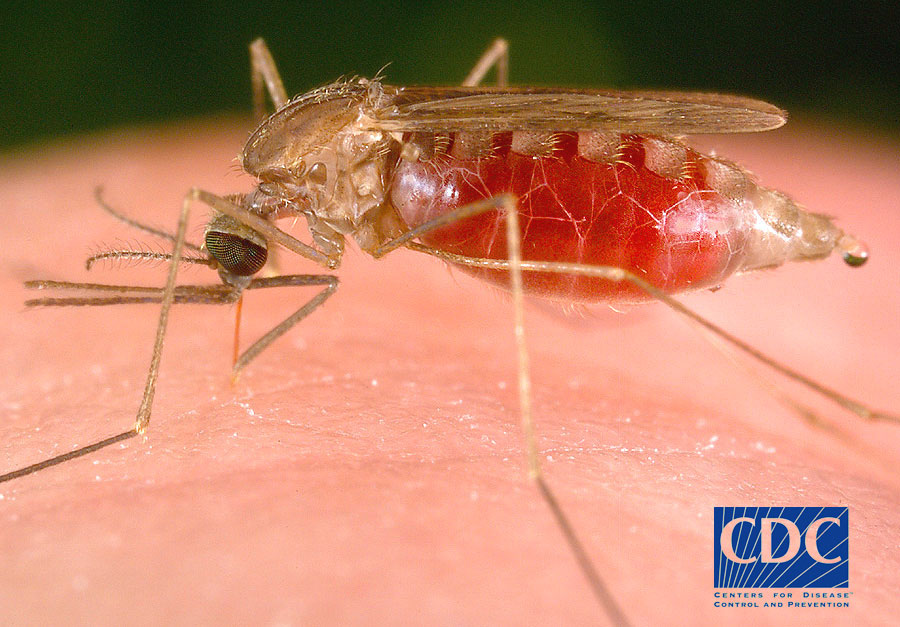
A recent article in the journal Nature discussed the response of plants and animals to current climate change. Phenologists, scientists who study how the periodic life cycle events of animals and plants are affected by variations in climate over the course of seasons and years, are finding that many species of birds are breeding and singing earlier in the year. Migrant birds are arriving earlier, butterflies are appearing earlier and some amphibians are spawning weeks ahead of their historical schedule. In addition, mountain tree lines, which are controlled by air temperature, have been advancing to higher altitudes in Europe, and Arctic shrubs are now found in regions that were once too cold for their existence in Alaska. While ecological changes such as these may not be threatening from a human perspective, others are. For example, malaria-carrying mosquitoes in Africa are now being found at altitudes that were once too cold for them, and outbreaks of malaria are showing up in towns and villages once thought to be out of their reach. In parts of California and Australia, fire ants are migrating to regions that historically have been too cold to support them.
The Arctic and Antarctic are the regions experiencing the most rapid changes due to the recent warming of the earth’s atmosphere. These two regions on Earth are a part of the cryosphere, which is defined as the part of the Earth that is occupied by sea ice, lake ice, ice caps and permafrost . (For a comprehensive overview of the current state of the cryosphere and an excellent archive of data, please check out “ The Cryosphere Today ”) As explained in the Module Milankovitch Cycles and the Climate of the Quaternary , these regions are most vulnerable due to the powerful ice-albedo effect. One amazing depiction of polar warming can be found in the drunken forests of Siberia. Larch and spruce trees there are often seen tilted over on their sides and growing at strange angles. Why? Because the once continually frozen soil, or permafrost, in which they are rooted has been melting in recent years. As the soil thaws it becomes more malleable and the trees begin to slant as the soil beneath them sinks. Farther north, Arctic sea ice has been decreasing both in extent and concentration. In 2007, the smallest extent of sea ice was measured since the 1970s, and the Northwest Passage opened for commerce and exploration. As the sea ice extent and concentration decreases, so does the habitat of polar bears. The sea ice is a vital part of their hunting grounds, and recent decreases of this ice have greatly reduced their access to certain prey. In addition to sea ice reductions, surface melt of the ice sheet on Greenland has increased in recent years, especially along its edges. This melt has lead to large pools and streams forming on top of this mile-thick sheet of ice. On the other side of the world, the Larsen B ice shelf in Antarctica recently collapsed, sending a large section of ice into the sea. This section of the Antarctic ice cap was roughly as large as the state of Rhode Island and it had been stably attached to the ice shelf for the past 12,000 years. Scientists are closely watching the Antarctic ice as nearly two-thirds of the world’s fresh water resides there. Finally, alpine glacier retreat has been observed on every continent. With few exceptions, these glaciers have been retracting heavily since the 1960s, and over that time period NASA reports a global loss of 8,000 cubic kilometers of ice, which represents a what percentage reduction?
Notification Switch
Would you like to follow the 'Sustainability: a comprehensive foundation' conversation and receive update notifications?

|
|

|
|

|
|

|
|

|
|

|
|

|
|
|
|
|
|
|
|

|