<< Chapter < Page Chapter >> Page >

Aardrykskunde

Graad 5

Kaartwerk

Module 4

Soorte kaarte

1. Soorte kaarte

Elke kaart vertel sy eie storie. Werk in 'n groep en soek in die atlas voorbeelde van die volgende soorte kaarte:

staatkundig;

reliëfkaarte;

klimaatkaarte;

plantegroeikaarte;

bevolkingsverspreidingskaarte.

Aktiwiteit 1:

Om nuttige inligting te kies en te gebruik

[lu 1.3]

Kies uit die verskillende moontlikhede wat verskaf word en voltooi die tweede kolom sodat dit by die regte kaart pas.

Soorte kaarte Watter storie vertel dit? Moontlike keuses
Staatkundige kaarte Dui grense van lande aan
Reliëfkaarte waar mense woon
Klimaatkaarte Berge, valleie in 'n gebied
Plantegroeikaarte Die weer van die gebied
Bevolkingskaarte Die plante van die gebied

2. Kleurgebruik op ‘n kaart

  • ‘n Reliëfkaart dui die verskillende hoogtes van areas binne ‘n land aan (die bou van die land). Gebiede met naastenby dieselfde hoogte word in dieselfde kleur ingekleur. Volgens die fisiese bou van die land word daar ook sekere gebiede geïdentifiseer. So kry ons vlaktes, berge, riviere, moerasse, damme, plato’s, ens. Hier volg die verduideliking van ‘n paar:

KUSVLAKTE - laagliggende strook land naby die see

PLATO - ‘n redelike gelyk landskap wat hoog bo seevlak in die binneland lê

VLAKTE - plat, gelyk stukke grond

BERGE - hoogliggend - ‘n groep berge word ‘n bergreeks genoem

  • ( Let op die sleutel wat spesifieke hoogtes aandui. Die kleurname in hakies is bloot ‘n aanduiding van die kleur wat in die meeste atlasse vir gebiede met daardie spesifieke hoogte gebruik word.)
  • Sou jy na ‘n deursnit van Suid-Afrika kyk, sal die profiel soos volg lyk met die kusvlakte aan die westekant wat dan opbou na die plato in die sentrale deel van die land en daarna weer geleidelik daal tot by die kusvlakte aan die ooskus:

3. Hoe gebruik ons kaarte?

Om 'n kaart suksesvol te gebruik moet julle die volgende verstaan:

Die opskrif of titel

‘n Kaart moet altyd deur sy opskrif aandui watter spesifieke inligting dit bevat. Kyk na enige kaart in jou atlas en jy sal sien dat daar bo-aan ‘n naam vir die kaart gegee word, bv. AFRIKA Staatkundig.

Rigting

Julle moet weet watter kant van die kaart na NOORD wys. As julle die kaart so draai dat dit na ware noord wys, het julle die kaart georiënteer. Onthou julle nog die woord?

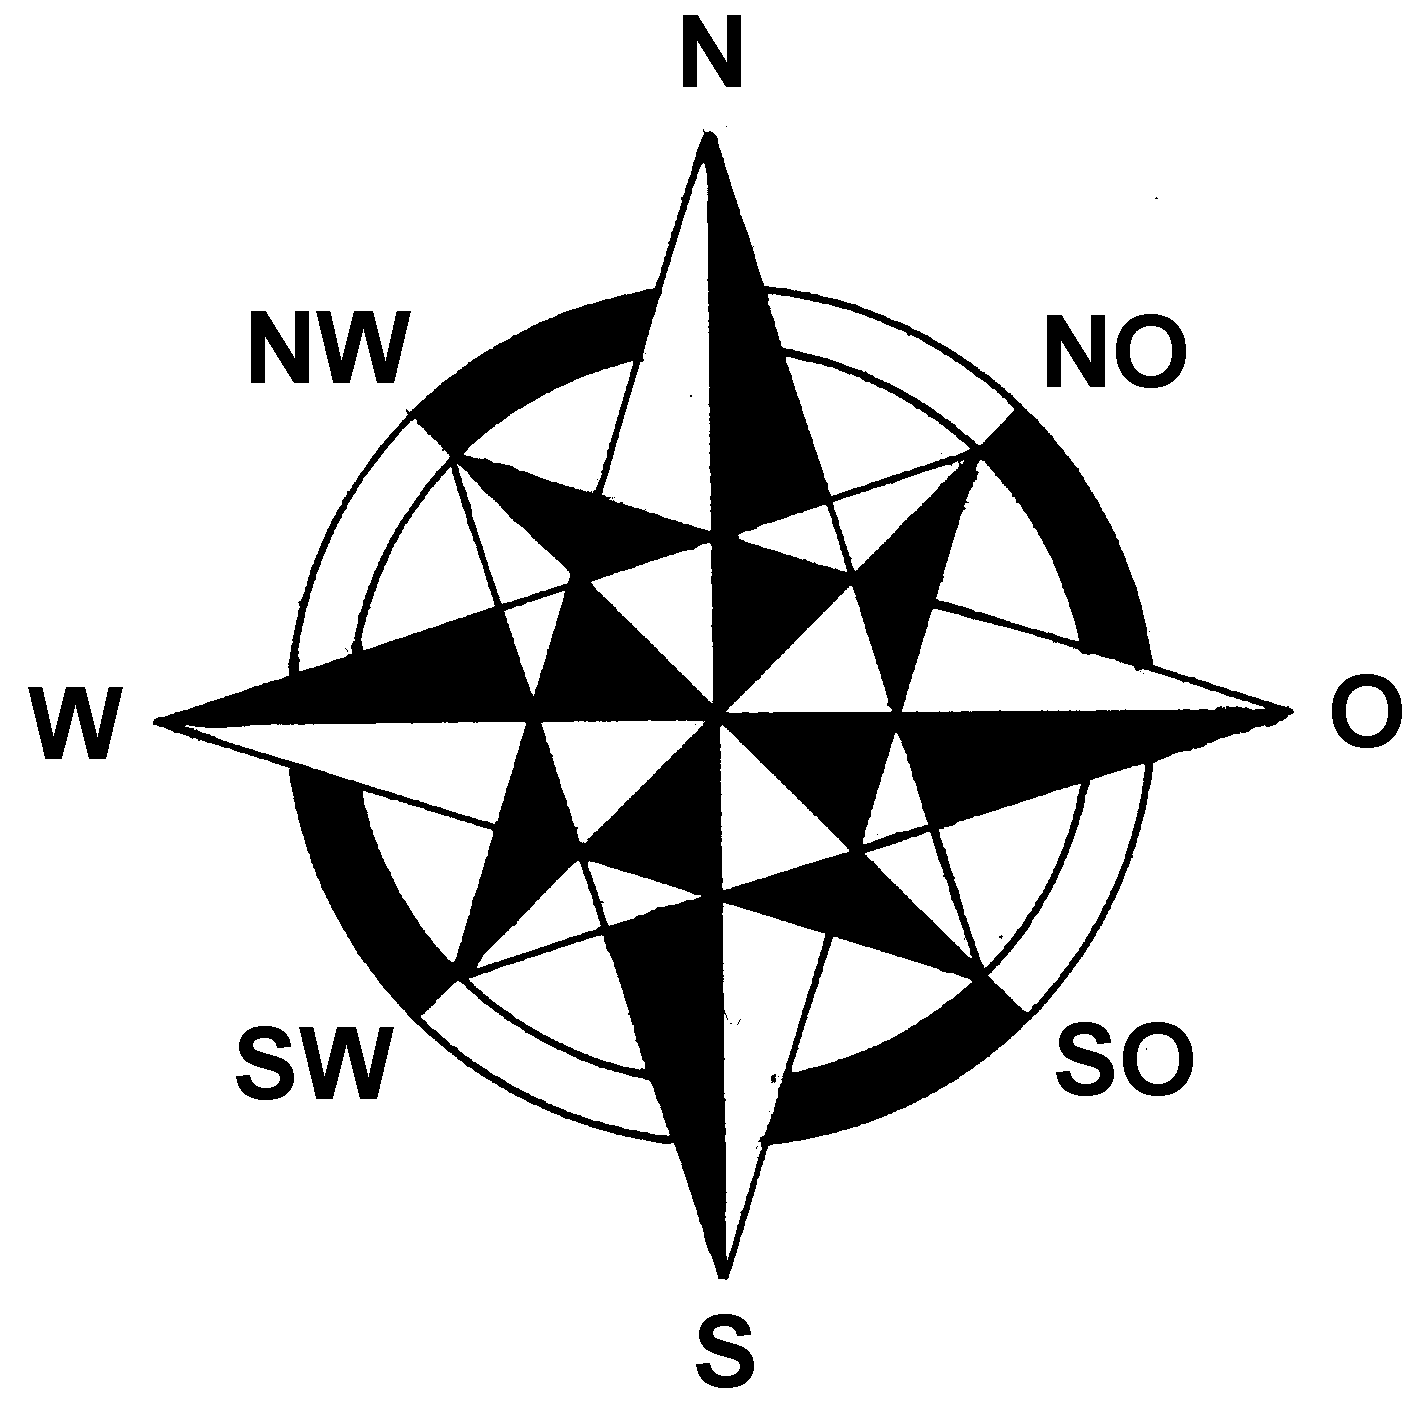
Julle het reeds in graad 4 geleer van die kompas wat ‘n instrument is waarmee noord vasgestel kan word.

Daar is ‘n aantal maniere om uit te vind waar noord is as julle nie ‘n kompas het nie:

deur jou horlosie te gebruik as dit ‘n uur- en minuutwyser het;

die skadustokmetode , deur die kortste skaduwee gedurende die dag te vind;

deur snags ‘n eenvoudige berekening te doen met behulp van die sterrebeeld, die suiderkruis ; en

die eenvoudigste manier is om vas te stel waar die son opkom en ondergaan. Die son gaan in die weste onder en kom in die ooste op. As jy weet waar oos en wes is, is dit maklik om die ander uit te werk.

Assessering

LU 1

AARDRYKSKUNDIGE ONDERSOEK

Die leerder is in staat om ondersoekvaardighede te gebruik om aardrykskundige en omgewingsbegrippe en -prosesse te ondersoek.

Dit is duidelik wanneer die leerder:

  • bronne met nuttige aardrykskundige inligting kan kies en gebruik;
  • inligting kategoriseer;
  • sketskaarte en/of planne na aanleiding van veldwaarnemings en afmetings teken;
  • ‘n indeks gebruik om plekke op wêreldatlaskaarte te vind;
  • deur projekte, bespreking, debat en diagramme, kennis en begrip van die vraagstuk toon [dra die antwoord oor].

Questions & Answers

differentiate between demand and supply giving examples
Lambiv Reply
differentiated between demand and supply using examples
Lambiv
what is labour ?
Lambiv
how will I do?
Venny Reply
how is the graph works?I don't fully understand
Rezat Reply
information
Eliyee
devaluation
Eliyee
t
WARKISA
hi guys good evening to all
Lambiv
multiple choice question
Aster Reply
appreciation
Eliyee
explain perfect market
Lindiwe Reply
In economics, a perfect market refers to a theoretical construct where all participants have perfect information, goods are homogenous, there are no barriers to entry or exit, and prices are determined solely by supply and demand. It's an idealized model used for analysis,
Ezea
What is ceteris paribus?
Shukri Reply
other things being equal
AI-Robot
When MP₁ becomes negative, TP start to decline. Extuples Suppose that the short-run production function of certain cut-flower firm is given by: Q=4KL-0.6K2 - 0.112 • Where is quantity of cut flower produced, I is labour input and K is fixed capital input (K-5). Determine the average product of lab
Kelo
Extuples Suppose that the short-run production function of certain cut-flower firm is given by: Q=4KL-0.6K2 - 0.112 • Where is quantity of cut flower produced, I is labour input and K is fixed capital input (K-5). Determine the average product of labour (APL) and marginal product of labour (MPL)
Kelo
yes,thank you
Shukri
Can I ask you other question?
Shukri
what is monopoly mean?
Habtamu Reply
What is different between quantity demand and demand?
Shukri Reply
Quantity demanded refers to the specific amount of a good or service that consumers are willing and able to purchase at a give price and within a specific time period. Demand, on the other hand, is a broader concept that encompasses the entire relationship between price and quantity demanded
Ezea
ok
Shukri
how do you save a country economic situation when it's falling apart
Lilia Reply
what is the difference between economic growth and development
Fiker Reply
Economic growth as an increase in the production and consumption of goods and services within an economy.but Economic development as a broader concept that encompasses not only economic growth but also social & human well being.
Shukri
production function means
Jabir
What do you think is more important to focus on when considering inequality ?
Abdisa Reply
any question about economics?
Awais Reply
sir...I just want to ask one question... Define the term contract curve? if you are free please help me to find this answer 🙏
Asui
it is a curve that we get after connecting the pareto optimal combinations of two consumers after their mutually beneficial trade offs
Awais
thank you so much 👍 sir
Asui
In economics, the contract curve refers to the set of points in an Edgeworth box diagram where both parties involved in a trade cannot be made better off without making one of them worse off. It represents the Pareto efficient allocations of goods between two individuals or entities, where neither p
Cornelius
In economics, the contract curve refers to the set of points in an Edgeworth box diagram where both parties involved in a trade cannot be made better off without making one of them worse off. It represents the Pareto efficient allocations of goods between two individuals or entities,
Cornelius
Suppose a consumer consuming two commodities X and Y has The following utility function u=X0.4 Y0.6. If the price of the X and Y are 2 and 3 respectively and income Constraint is birr 50. A,Calculate quantities of x and y which maximize utility. B,Calculate value of Lagrange multiplier. C,Calculate quantities of X and Y consumed with a given price. D,alculate optimum level of output .
Feyisa Reply
Answer
Feyisa
c
Jabir
the market for lemon has 10 potential consumers, each having an individual demand curve p=101-10Qi, where p is price in dollar's per cup and Qi is the number of cups demanded per week by the i th consumer.Find the market demand curve using algebra. Draw an individual demand curve and the market dema
Gsbwnw Reply
suppose the production function is given by ( L, K)=L¼K¾.assuming capital is fixed find APL and MPL. consider the following short run production function:Q=6L²-0.4L³ a) find the value of L that maximizes output b)find the value of L that maximizes marginal product
Abdureman
types of unemployment
Yomi Reply
What is the difference between perfect competition and monopolistic competition?
Mohammed
Got questions? Join the online conversation and get instant answers!
Jobilize.com Reply

Get Jobilize Job Search Mobile App in your pocket Now!

Get it on Google Play Download on the App Store Now


Source:  OpenStax, Sosiale wetenskappe: aardrykskunde graad 5. OpenStax CNX. Sep 22, 2009 Download for free at http://cnx.org/content/col10985/1.2
Google Play and the Google Play logo are trademarks of Google Inc.

Notification Switch

Would you like to follow the 'Sosiale wetenskappe: aardrykskunde graad 5' conversation and receive update notifications?

Ask