

| << Chapter < Page | Chapter >> Page > |
Linear Predictive Coding or LPC is usually applied for speech compression but we will be utilizing its very output dependent form for analysis of our signal. The fundamental principle behind LPC is that one can predict or approximate the future elements of a signal based on linear combinations of the previous signal elements and, of course, and an input excitation signal.
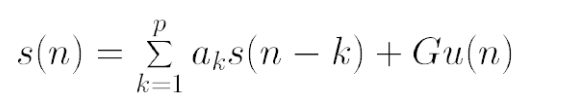
The effectiveness of this model stems from fact that the processes that generate speech in the human body are relatively slow and that the human voice is quite limited in frequency range. The physical model of the vocal tract in LPC is a buzzer, corresponding the glottis which produces the baseline buzz in the human voice, at the end of a tube which has linear characteristics.

In “systems” speak we clearly see the form of a feedback filter emerging so to further analyze the system we take its Z-transform and find a transfer function from U[z] to S[z].
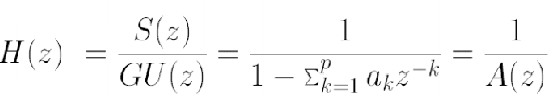
The result is clearly an all pole filter and in standard application one would feed in the generating signal and get out a compressed version of the output.

The key barrier to implementing this filter is of course determining the “a” values or the coefficients of our linear superposition approximation of the output signal. Ultimately when we form the linear superposition, we want to choose coefficients that yield a compressed signal with the minimum deviation from the original signal; equivalently we want to minimize the difference(error) between the two signals.

From the form of s(n) we can derive and equivalent condition on the auto-correlation R[j].

Where:

Thus, we have p such equations, one for each R(j) and so we can more easily describe our conditions in terms of a matrix equation.

The matrix we now need to invert and multiply has a unique constant diagonal structure which classifies it as a Toeplitz matrix. There have been multiple methods developed for solving equations with Toeplitz matrices and one of the most efficient method, the method we used, is the the Levinson Durbin algorithm. This method is a bit involved but fundamentally it solves the system of equations by solving smaller sub-matrix equations and iterating up to get a recursive solution for all the coefficients.
To reapply this method, this filter, towards our goal of speech analysis we first note that the form of the filter primarily dependent on the output rather than the input. The coefficients that we derived using the Levinson Durbin algorithm only use properties (the auto-correlation) of the output signal rather than the input signal. This means that this filter, in a way, is more natural as a method for going form output to input rather than the reverse, all we need do is take the reciprocal of the transfer function.

We go from an all pole filter to an all zero filter which now takes in a speech signal and returns the generating signal. This transfer function is actually more useful for our purposes because of our method of analyzing speech signals. We are primarily looking to identify the formants in the speech signal, the fundamental components of phonemes that make up human alphabets. These formants directly correspond to the resonant modes of the vocal tract, so we are effectively trying to achieve a natural mode decomposition of a complex resonant cavity.

Therefore these formants are more easily identifiable in the generating signal (since there are inherently a property of the generating cavity). With the filter generated by LPC we can now reconstruct a linear approximation of the generation signal using the speech signals from our soundbank. Our full signal of course can be represented by a spectrogram and the formant correspond to the local maxima of each time slice of the spectrogram.
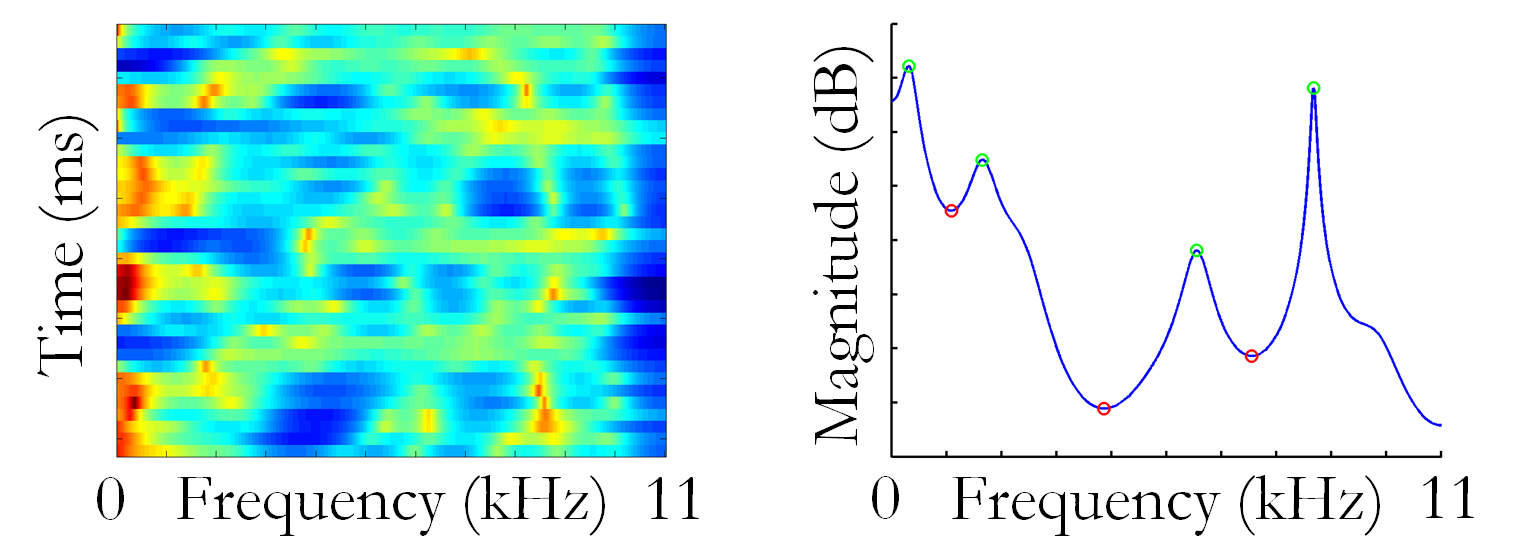
What we chose to extract from these spectrograms were the amplitude and frequency data of the first 4 formants present in the signal, as these are usually the most dominant, as well as the same information about the minima in between the peaks. This is the information we will need to feed into our classifier for emotion classification.
Notification Switch
Would you like to follow the 'Robust classification of highly-specific emotion in human speech' conversation and receive update notifications?

|
|

|
|

|
|

|
|

|
|

|
|

|
|

|
|

|
|

|