<< Chapter < Page Chapter >> Page >

Geography

Grade 5

Climate and vegetation regions of south africa

Module 11

Weather from day to day

1. Weather Guide

  • There are various sources in the media daily that supply the reader and listener or viewer with the expected weather conditions for the day or the next few days.

Activity 1:

To study a weather guide and complete the table

[lo 1.3]

Study the copy of a weather guide from Die Burger of 2 October 2004 and complete the table that follows.

Maximum temperature for Vredendal
Minimum temperature for Oudtshoorn
Will fog occur?
Wind direction at Cape Town
Is rain expected?
What will the weather be like at George on Sunday 3 October?
What type of clothing will you wear in Clanwilliam?
The Riversdale Primary School is organizing a sports day for Tuesday 5 October. Will it take place?

2. Weather instruments

To be able to record the weather, different instruments are needed.

Activity 2:

To study the following sketch and find out how the instruments work. then complete the table.

[lo 1.2]

Elements of the Weather Types of Instrument
Temperature
Wind
Rainfall
Air pressure

Activity 3:

To consult the appropriate sources and build your own weather vane and rain gauge.

[lo 1.2]

Use these instruments and a thermometer that someone has brought to class to monitor the weather every day for one month. Write your observations in the table below. (You can also compare your observations with the weather report in the newspaper.)
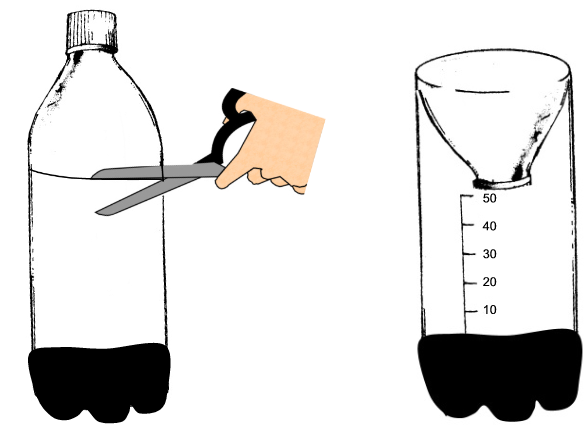
Rain gauge
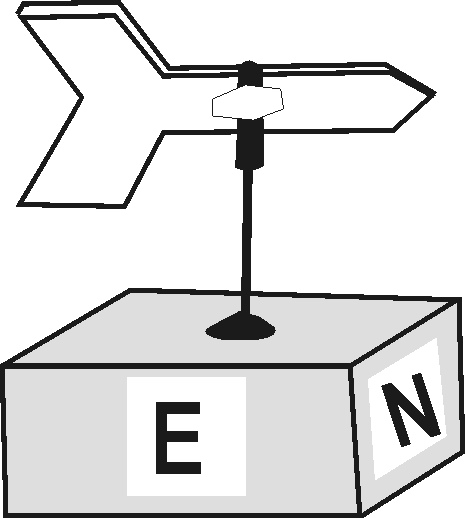
Weather vane

Date Max temp.measured 14:00 Wind direction Cloud rack Rainfall in mm
Monday____ May 20 °C NO Partly cloudy 2 mm
Tuesday_____ May 18 °C N Cloudy 8 mm
Wednesday___ May 22 °C N Partly cloudy 0 mm

Assessment

LO 1

GEOGRAPHICAL ENQUIRY

The learner will be able to use enquiry skills to investigate geographical and environmental concepts and processes.

We know this when the learner:

1.1 with guidance, selects and uses sources of useful geographical information (including graphs, maps and fieldwork outside the classroom) [finds sources];

  • distinguishes between facts and opinions [works with sources];
  • categorises information [works with sources];
  • draws sketch maps and/or plans from field observation and measurements [works with sources];

1.7 demonstrates knowledge and under-standing of the issue through projects, discussion, debate and charts [communicates the answer].

Memorandum

ACTIVITY 1

Maximum temperature for Vredendal 28ºC
Minimum temperature for Oudtshoorn 10ºC
Will fog occur? West Coast
Wind direction at Cape Town SE
Is rain expected? For Sunday
What will the weather be like at George on Sunday 3 October? Partly Cloudy; SW wind 25; Temp. 12/22
What type of clothing will you wear in Clanwilliam? Cool (very hot day)
The Riversdale Primary School is organizing a sports day for Tuesday 5 October. Will it take place? They will have to have a plan B. 60%+ chance of rain

ACTIVITY 2

  • Thermometer
  • Wind Meter/wind sock/weather vane
  • Rain meter
  • Barometer

Questions & Answers

Ayele, K., 2003. Introductory Economics, 3rd ed., Addis Ababa.
Widad Reply
can you send the book attached ?
Ariel
?
Ariel
What is economics
Widad Reply
the study of how humans make choices under conditions of scarcity
AI-Robot
U(x,y) = (x×y)1/2 find mu of x for y
Desalegn Reply
U(x,y) = (x×y)1/2 find mu of x for y
Desalegn
what is ecnomics
Jan Reply
this is the study of how the society manages it's scarce resources
Belonwu
what is macroeconomic
John Reply
macroeconomic is the branch of economics which studies actions, scale, activities and behaviour of the aggregate economy as a whole.
husaini
etc
husaini
difference between firm and industry
husaini Reply
what's the difference between a firm and an industry
Abdul
firm is the unit which transform inputs to output where as industry contain combination of firms with similar production 😅😅
Abdulraufu
Suppose the demand function that a firm faces shifted from Qd  120 3P to Qd  90  3P and the supply function has shifted from QS  20  2P to QS 10  2P . a) Find the effect of this change on price and quantity. b) Which of the changes in demand and supply is higher?
Toofiq Reply
explain standard reason why economic is a science
innocent Reply
factors influencing supply
Petrus Reply
what is economic.
Milan Reply
scares means__________________ends resources. unlimited
Jan
economics is a science that studies human behaviour as a relationship b/w ends and scares means which have alternative uses
Jan
calculate the profit maximizing for demand and supply
Zarshad Reply
Why qualify 28 supplies
Milan
what are explicit costs
Nomsa Reply
out-of-pocket costs for a firm, for example, payments for wages and salaries, rent, or materials
AI-Robot
concepts of supply in microeconomics
David Reply
economic overview notes
Amahle Reply
identify a demand and a supply curve
Salome Reply
i don't know
Parul
there's a difference
Aryan
Demand curve shows that how supply and others conditions affect on demand of a particular thing and what percent demand increase whith increase of supply of goods
Israr
Hi Sir please how do u calculate Cross elastic demand and income elastic demand?
Abari
Got questions? Join the online conversation and get instant answers!
Jobilize.com Reply

Get Jobilize Job Search Mobile App in your pocket Now!

Get it on Google Play Download on the App Store Now


Source:  OpenStax, Social sciences: geography grade 5. OpenStax CNX. Sep 23, 2009 Download for free at http://cnx.org/content/col10986/1.2
Google Play and the Google Play logo are trademarks of Google Inc.

Notification Switch

Would you like to follow the 'Social sciences: geography grade 5' conversation and receive update notifications?

Ask