<< Chapter < Page
  Digital signal processing - dsp     Page 15 / 21
Chapter >> Page >

A different plotting color scheme

Note that the plotting color scheme that I used for Figure 7 is different from any of the plots previously shown in this module. This color scheme is whatI refer to as the Color Contour scheme in the module titled Plotting 3D Surfaces using Java .

This scheme quantizes the range from the lowest to the highest elevation into 23 levels, coloring the lowest elevation black, the highest elevation white, andassigning very specific colors to the 21 levels in between. The colors and the levels that they represent are shown in the calibration scales under the plotsin Figure 7 . The lowest elevation is on the left end of the calibration scale. The highest elevation is on the right end of the calibration scale.

The amplitude spectrum

As before, the wavenumber amplitude spectrum with the origin in the top-left corner is shown in the top-right image in Figure 7 . The amplitude spectrum with the origin shifted to the center is shown in the lower right image in Figure 7 .

If you were to use the calibration scale to convert the colors along the horizontal and vertical axes in the lower right image into numeric values, youwould find that they approximate a rectified sin(x)/x shape as expected.

The output surface

The output surface produced by performing an inverse Fourier transform on the complex wavenumber spectrum is shown in the lower-left image in Figure 7 . This surface appears to match the input surface shown in the top-left image in Figure 7 .

The overall results

The numeric output for this case isn't very useful because none of the samples for which numeric data is provided fall within the square. However,because the real and imaginary parts exhibit the correct symmetry , , the shape of the amplitude spectrum is generally what we expect, and the output from the inverse Fouriertransform appears to match the original input causes us to conclude that the program is working properly in this case.

Case 3

This case places a raised box at the top near the origin in the space domain, but the box is not on the diagonal as it was in Case 2.

(See the top-left image in Figure 8 for the new location of the box.)

Figure 8. Graphic output for Case 3.
missing image

Amplitude spectrum should not change

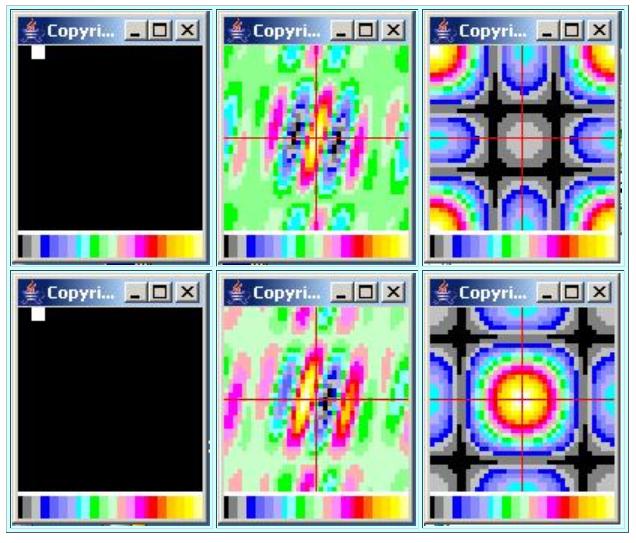
As long as the size and the orientation of the box doesn't change, the wavenumber amplitude spectrum should be the same as Case 2 regardless of thelocation of the box in space. Since the size and orientation of this box is the same as in Case 2, the amplitude spectrum for this case should be the same asfor Case 2.

The real and imaginary parts of the spectrum may change

However, the real and imaginary parts (or the phase) change as the location of the box changes relative to the origin in space.

A hypothetical example

The purpose of this case is to illustrate a hypothetical example. If two different photographic images contain a picture of the same object in the samesize and the same orientation in space, that object will contribute the same values to the amplitude spectrum of both images regardless of where the objectis located in the different images.

Questions & Answers

What are the factors that affect demand for a commodity
Florence Reply
differentiate between demand and supply giving examples
Lambiv Reply
differentiated between demand and supply using examples
Lambiv
what is labour ?
Lambiv
how will I do?
Venny Reply
how is the graph works?I don't fully understand
Rezat Reply
information
Eliyee
devaluation
Eliyee
t
WARKISA
hi guys good evening to all
Lambiv
multiple choice question
Aster Reply
appreciation
Eliyee
explain perfect market
Lindiwe Reply
In economics, a perfect market refers to a theoretical construct where all participants have perfect information, goods are homogenous, there are no barriers to entry or exit, and prices are determined solely by supply and demand. It's an idealized model used for analysis,
Ezea
What is ceteris paribus?
Shukri Reply
other things being equal
AI-Robot
When MP₁ becomes negative, TP start to decline. Extuples Suppose that the short-run production function of certain cut-flower firm is given by: Q=4KL-0.6K2 - 0.112 • Where is quantity of cut flower produced, I is labour input and K is fixed capital input (K-5). Determine the average product of lab
Kelo
Extuples Suppose that the short-run production function of certain cut-flower firm is given by: Q=4KL-0.6K2 - 0.112 • Where is quantity of cut flower produced, I is labour input and K is fixed capital input (K-5). Determine the average product of labour (APL) and marginal product of labour (MPL)
Kelo
yes,thank you
Shukri
Can I ask you other question?
Shukri
what is monopoly mean?
Habtamu Reply
What is different between quantity demand and demand?
Shukri Reply
Quantity demanded refers to the specific amount of a good or service that consumers are willing and able to purchase at a give price and within a specific time period. Demand, on the other hand, is a broader concept that encompasses the entire relationship between price and quantity demanded
Ezea
ok
Shukri
how do you save a country economic situation when it's falling apart
Lilia Reply
what is the difference between economic growth and development
Fiker Reply
Economic growth as an increase in the production and consumption of goods and services within an economy.but Economic development as a broader concept that encompasses not only economic growth but also social & human well being.
Shukri
production function means
Jabir
What do you think is more important to focus on when considering inequality ?
Abdisa Reply
any question about economics?
Awais Reply
sir...I just want to ask one question... Define the term contract curve? if you are free please help me to find this answer 🙏
Asui
it is a curve that we get after connecting the pareto optimal combinations of two consumers after their mutually beneficial trade offs
Awais
thank you so much 👍 sir
Asui
In economics, the contract curve refers to the set of points in an Edgeworth box diagram where both parties involved in a trade cannot be made better off without making one of them worse off. It represents the Pareto efficient allocations of goods between two individuals or entities, where neither p
Cornelius
In economics, the contract curve refers to the set of points in an Edgeworth box diagram where both parties involved in a trade cannot be made better off without making one of them worse off. It represents the Pareto efficient allocations of goods between two individuals or entities,
Cornelius
Suppose a consumer consuming two commodities X and Y has The following utility function u=X0.4 Y0.6. If the price of the X and Y are 2 and 3 respectively and income Constraint is birr 50. A,Calculate quantities of x and y which maximize utility. B,Calculate value of Lagrange multiplier. C,Calculate quantities of X and Y consumed with a given price. D,alculate optimum level of output .
Feyisa Reply
Answer
Feyisa
c
Jabir
the market for lemon has 10 potential consumers, each having an individual demand curve p=101-10Qi, where p is price in dollar's per cup and Qi is the number of cups demanded per week by the i th consumer.Find the market demand curve using algebra. Draw an individual demand curve and the market dema
Gsbwnw Reply
suppose the production function is given by ( L, K)=L¼K¾.assuming capital is fixed find APL and MPL. consider the following short run production function:Q=6L²-0.4L³ a) find the value of L that maximizes output b)find the value of L that maximizes marginal product
Abdureman
Got questions? Join the online conversation and get instant answers!
Jobilize.com Reply

Get Jobilize Job Search Mobile App in your pocket Now!

Get it on Google Play Download on the App Store Now


Source:  OpenStax, Digital signal processing - dsp. OpenStax CNX. Jan 06, 2016 Download for free at https://legacy.cnx.org/content/col11642/1.38
Google Play and the Google Play logo are trademarks of Google Inc.

Notification Switch

Would you like to follow the 'Digital signal processing - dsp' conversation and receive update notifications?

Ask