

| << Chapter < Page | Chapter >> Page > |
Use the following information to answer the next three exercises. 1; 1; 2; 3; 4; 4; 5; 5; 6; 7; 7; 8; 9
38 . What is the median for this data?
39 . What is the first quartile for this data?
40 . What is the third quartile for this data?
Use the following information to answer the next four exercises. This box plot represents scores on the final exam for a physics class.
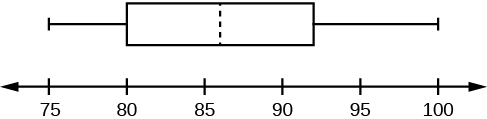
41 . What is the median for this data, and how do you know?
42 . What are the first and third quartiles for this data, and how do you know?
43 . What is the interquartile range for this data?
44 . What is the range for this data?
45 . In a marathon, the median finishing time was 3:35:04 (three hours, 35 minutes, and four seconds). You finished in 3:34:10. Interpret the meaning of the median time, and discuss your time in relation to it.
Use the following information to answer the next three exercises. The value, in thousands of dollars, for houses on a block, are: 45; 47; 47.5; 51; 53.5; 125.
46 . Calculate the mean for this data.
47 . Calculate the median for this data.
48 . Which do you think better reflects the average value of the homes on this block?
49 . In a left-skewed distribution, which is greater?
50 . In a right-skewed distribution, which is greater?
51 . In a symmetrical distribution what will be the relationship among the mean, median, and mode?
Use the following information to answer the next four exercises. 10; 11; 15; 15; 17; 22
52 . Compute the mean and standard deviation for this data; use the sample formula for the standard deviation.
53 . What number is two standard deviations above the mean of this data?
54 . Express the number 13.7 in terms of the mean and standard deviation of this data.
55 . In a biology class, the scores on the final exam were normally distributed, with a mean of 85, and a standard deviation of five. Susan got a final exam score of 95. Express her exam result as a z -score, and interpret its meaning.
Use the following information to answer the next two exercises. You have a jar full of marbles: 50 are red, 25 are blue, and 15 are yellow. Assume you draw one marble at random for each trial, and replace it before the next trial.
Let
P (
R ) = the probability of drawing a red marble.
Let
P (
B ) = the probability of drawing a blue marble.
Let
P (
Y ) = the probability of drawing a yellow marble.
56 . Find P ( B ).
57 . Which is more likely, drawing a red marble or a yellow marble? Justify your answer numerically.
Use the following information to answer the next two exercises. The following are probabilities describing a group of college students.
Let
P (
M ) = the probability that the student is male
Let
P (
F ) = the probability that the student is female
Let
P (
E ) = the probability the student is majoring in education
Let
P (
S ) = the probability the student is majoring in science
58 . Write the symbols for the probability that a student, selected at random, is both female and a science major.
Notification Switch
Would you like to follow the 'Introductory statistics' conversation and receive update notifications?

|
|
|
|
|

|
|

|
|

|
|

|
|

|
|

|
|

|
|

|
|

|
|

|