<< Chapter < Page Chapter >> Page >
This figure includes a graph labeled, “Atomic Number,” on the horizontal axis and, “Ionization Energy (k J divided by mol),” on the vertical axis. Markings are provided on the horizontal axis at 10, 18, 36, 54, and 86. Vertical lines extend from the horizontal axis upward at each of these values. The vertical axis begins at 0 and increases by 500’s up to 2500. Horizontal lines are drawn across the graph at multiples of 500. A red jagged line connects the ionization energies for elements with atomic numbers 1 through 86 on the graph. Peaks are evident at the locations of the noble or inert gases: H e, N e, A r, K r, X e, and R n. Similarly, minima exist at the locations of the alkali metals: L i, N a, K, R b, and C s. Elements labeled on the graph and their associated ionization energies are as follows: H 1310, H e 2370, L i 520, B e 900, B 800, C 1090, N 1400, O 1310, F 1680, N e 2080, N a 490, M g 730, P 1060, A r 1520, K 420, Z n 910, A s 960, B r 1140, K r 1350, R b 400, C d 870, X e 1170, T l 590, and R n 1030.
The first ionization energy of the elements in the first five periods are plotted against their atomic number.
The figure includes a periodic table with the title, “First Ionization Energies of Some Elements (k J per mol).” The table identifies the row or period number at the left in purple, and group or column numbers in blue above each column. First ionization energies listed top to bottom for group 1 are: H 1310, L i 520, N a 490, K 420, R b 400, C s 380, and three dots are placed in the box for F r. In group 2 the values are: B e 900, M g 730, C a 590, S r 550, and B a 500. In group 3 the values are: S c 630, Y 620, and L a 540. In group 4, the values are: T i 660, Z r 660, H f 700. In group 5, the values are: V 650, N b 670, and T a 760. In group 6, the values are: C r 660, M o 680, and W 770. In group 7, the values are: M n 710, T c 700, and R e 760. In group 8, the values are: F e 760, R u 720, and O s 840. In group 9, the values are: C o 760, R h 720, and I r 890. In group 10, the values are: N i 730, P d 800, and P t 870. In group 11, the values are: C u 740, A g 730, and A u 890. In group 12, the values are: Z n 910, C d 870, and H g 1000. In group 13, the values are: B 800, A l 580, G a 580, I n 560, and T l 590. In group 14, the values are: C 1090, S i 780, G e 780, S n 700, and P b 710. In group 15, the values are: N 1400, P 1060, A s 960, S b 830, and B i 800. In group 16, the values are: O 1310, S 1000, S e 950, T e 870, and P o 810. In group 17, the values are: F 1680, C l 1250, B r 1140, I 1010, and A t has three dots. In group 18, the values listed are: B e 2370, N e 2080, A r 1520, K r 1350, X e 1170, and R n 1030.
This version of the periodic table shows the first ionization energy of (IE 1 ), in kJ/mol, of selected elements.

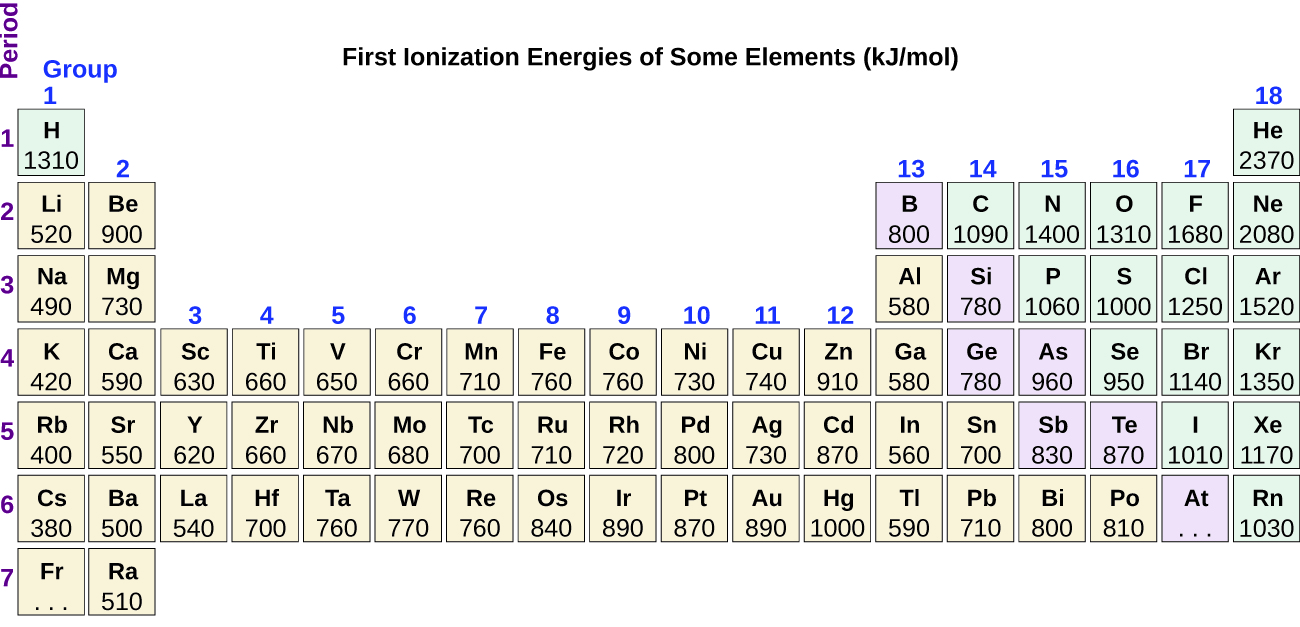
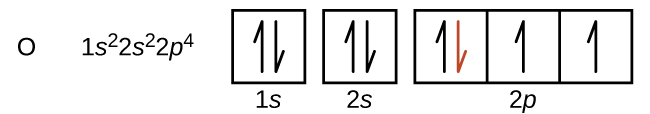
Another deviation occurs as orbitals become more than one-half filled. The first ionization energy for oxygen is slightly less than that for nitrogen, despite the trend in increasing IE 1 values across a period. Looking at the orbital diagram of oxygen, we can see that removing one electron will eliminate the electron–electron repulsion caused by pairing the electrons in the 2 p orbital and will result in a half-filled orbital (which is energetically favorable). Analogous changes occur in succeeding periods (note the dip for sulfur after phosphorus in [link] ).

This figure includes the element symbol O followed by the electron configuration 1 s superscript 2 2 s superscript 2 2 p superscript 4. An orbital diagram follows, which consists of two individual squares, labeled as, “1 s,” and, “2 s,” below followed by a grouping of three connected squares which are labeled, “2 p.” All boxes are oriented in a row. The two individual squares and the first square in the row of connected squares contain a pair of half arrows. One half arrow in each pair points up, and one points down. The downward pointing arrow in the first square in the row of connected squares is red. The remaining two squares each contain single upward pointing half arrows.

Removing an electron from a cation is more difficult than removing an electron from a neutral atom because of the greater electrostatic attraction to the cation. Likewise, removing an electron from a cation with a higher positive charge is more difficult than removing an electron from an ion with a lower charge. Thus, successive ionization energies for one element always increase. As seen in [link] , there is a large increase in the ionization energies (color change) for each element. This jump corresponds to removal of the core electrons, which are harder to remove than the valence electrons. For example, Sc and Ga both have three valence electrons, so the rapid increase in ionization energy occurs after the third ionization.

Successive Ionization Energies for Selected Elements (kJ/mol)
Element IE 1 IE 2 IE 3 IE 4 IE 5 IE 6 IE 7
K 418.8 3051.8 4419.6 5876.9 7975.5 9590.6 11343
Ca 589.8 1145.4 4912.4 6490.6 8153.0 10495.7 12272.9
Sc 633.1 1235.0 2388.7 7090.6 8842.9 10679.0 13315.0
Ga 578.8 1979.4 2964.6 6180 8298.7 10873.9 13594.8
Ge 762.2 1537.5 3302.1 4410.6 9021.4 Not available Not available
As 944.5 1793.6 2735.5 4836.8 6042.9 12311.5 Not available

Ranking ionization energies

Predict the order of increasing energy for the following processes: IE 1 for Al, IE 1 for Tl, IE 2 for Na, IE 3 for Al.

Solution

Removing the 6 p 1 electron from Tl is easier than removing the 3 p 1 electron from Al because the higher n orbital is farther from the nucleus, so IE 1 (Tl)<IE 1 (Al). Ionizing the third electron from Al ( Al 2+ Al 3+ + e ) requires more energy because the cation Al 2+ exerts a stronger pull on the electron than the neutral Al atom, so IE 1 (Al)<IE 3 (Al). The second ionization energy for sodium removes a core electron, which is a much higher energy process than removing valence electrons. Putting this all together, we obtain: IE 1 (Tl)<IE 1 (Al)<IE 3 (Al)<IE 2 (Na).

Check your learning

Which has the lowest value for IE 1 : O, Po, Pb, or Ba?

Answer:

Ba

Got questions? Get instant answers now!

Variation in electron affinities

The electron affinity    [EA] is the energy change for the process of adding an electron to a gaseous atom to form an anion (negative ion).

X ( g ) + e X ( g ) EA 1

This process can be either endothermic or exothermic, depending on the element. The EA of some of the elements is given in [link] . You can see that many of these elements have negative values of EA, which means that energy is released when the gaseous atom accepts an electron. However, for some elements, energy is required for the atom to become negatively charged and the value of their EA is positive. Just as with ionization energy, subsequent EA values are associated with forming ions with more charge. The second EA is the energy associated with adding an electron to an anion to form a –2 ion, and so on.

Questions & Answers

differentiate between demand and supply giving examples
Lambiv Reply
differentiated between demand and supply using examples
Lambiv
what is labour ?
Lambiv
how will I do?
Venny Reply
how is the graph works?I don't fully understand
Rezat Reply
information
Eliyee
devaluation
Eliyee
t
WARKISA
hi guys good evening to all
Lambiv
multiple choice question
Aster Reply
appreciation
Eliyee
explain perfect market
Lindiwe Reply
In economics, a perfect market refers to a theoretical construct where all participants have perfect information, goods are homogenous, there are no barriers to entry or exit, and prices are determined solely by supply and demand. It's an idealized model used for analysis,
Ezea
What is ceteris paribus?
Shukri Reply
other things being equal
AI-Robot
When MP₁ becomes negative, TP start to decline. Extuples Suppose that the short-run production function of certain cut-flower firm is given by: Q=4KL-0.6K2 - 0.112 • Where is quantity of cut flower produced, I is labour input and K is fixed capital input (K-5). Determine the average product of lab
Kelo
Extuples Suppose that the short-run production function of certain cut-flower firm is given by: Q=4KL-0.6K2 - 0.112 • Where is quantity of cut flower produced, I is labour input and K is fixed capital input (K-5). Determine the average product of labour (APL) and marginal product of labour (MPL)
Kelo
yes,thank you
Shukri
Can I ask you other question?
Shukri
what is monopoly mean?
Habtamu Reply
What is different between quantity demand and demand?
Shukri Reply
Quantity demanded refers to the specific amount of a good or service that consumers are willing and able to purchase at a give price and within a specific time period. Demand, on the other hand, is a broader concept that encompasses the entire relationship between price and quantity demanded
Ezea
ok
Shukri
how do you save a country economic situation when it's falling apart
Lilia Reply
what is the difference between economic growth and development
Fiker Reply
Economic growth as an increase in the production and consumption of goods and services within an economy.but Economic development as a broader concept that encompasses not only economic growth but also social & human well being.
Shukri
production function means
Jabir
What do you think is more important to focus on when considering inequality ?
Abdisa Reply
any question about economics?
Awais Reply
sir...I just want to ask one question... Define the term contract curve? if you are free please help me to find this answer 🙏
Asui
it is a curve that we get after connecting the pareto optimal combinations of two consumers after their mutually beneficial trade offs
Awais
thank you so much 👍 sir
Asui
In economics, the contract curve refers to the set of points in an Edgeworth box diagram where both parties involved in a trade cannot be made better off without making one of them worse off. It represents the Pareto efficient allocations of goods between two individuals or entities, where neither p
Cornelius
In economics, the contract curve refers to the set of points in an Edgeworth box diagram where both parties involved in a trade cannot be made better off without making one of them worse off. It represents the Pareto efficient allocations of goods between two individuals or entities,
Cornelius
Suppose a consumer consuming two commodities X and Y has The following utility function u=X0.4 Y0.6. If the price of the X and Y are 2 and 3 respectively and income Constraint is birr 50. A,Calculate quantities of x and y which maximize utility. B,Calculate value of Lagrange multiplier. C,Calculate quantities of X and Y consumed with a given price. D,alculate optimum level of output .
Feyisa Reply
Answer
Feyisa
c
Jabir
the market for lemon has 10 potential consumers, each having an individual demand curve p=101-10Qi, where p is price in dollar's per cup and Qi is the number of cups demanded per week by the i th consumer.Find the market demand curve using algebra. Draw an individual demand curve and the market dema
Gsbwnw Reply
suppose the production function is given by ( L, K)=L¼K¾.assuming capital is fixed find APL and MPL. consider the following short run production function:Q=6L²-0.4L³ a) find the value of L that maximizes output b)find the value of L that maximizes marginal product
Abdureman
types of unemployment
Yomi Reply
What is the difference between perfect competition and monopolistic competition?
Mohammed
Got questions? Join the online conversation and get instant answers!
Jobilize.com Reply
Practice Key Terms 5

Get Jobilize Job Search Mobile App in your pocket Now!

Get it on Google Play Download on the App Store Now


Source:  OpenStax, Chemistry. OpenStax CNX. May 20, 2015 Download for free at http://legacy.cnx.org/content/col11760/1.9
Google Play and the Google Play logo are trademarks of Google Inc.

Notification Switch

Would you like to follow the 'Chemistry' conversation and receive update notifications?

Ask