<< Chapter < Page Chapter >> Page >
A flowchart shows a box containing chemistry at its center. Chemistry is connected to geochemistry, nuclear chemistry, chemical physics, nanoscience and nanotechnology, materials science, chemical engineering, biochemistry and molecular biology, environmental science, agriculture, and mathematics. Each of these disciplines is further connected to other related fields including medicine, biology, food science, geology earth sciences, toxicology, physics, and computer science.
Knowledge of chemistry is central to understanding a wide range of scientific disciplines. This diagram shows just some of the interrelationships between chemistry and other fields.

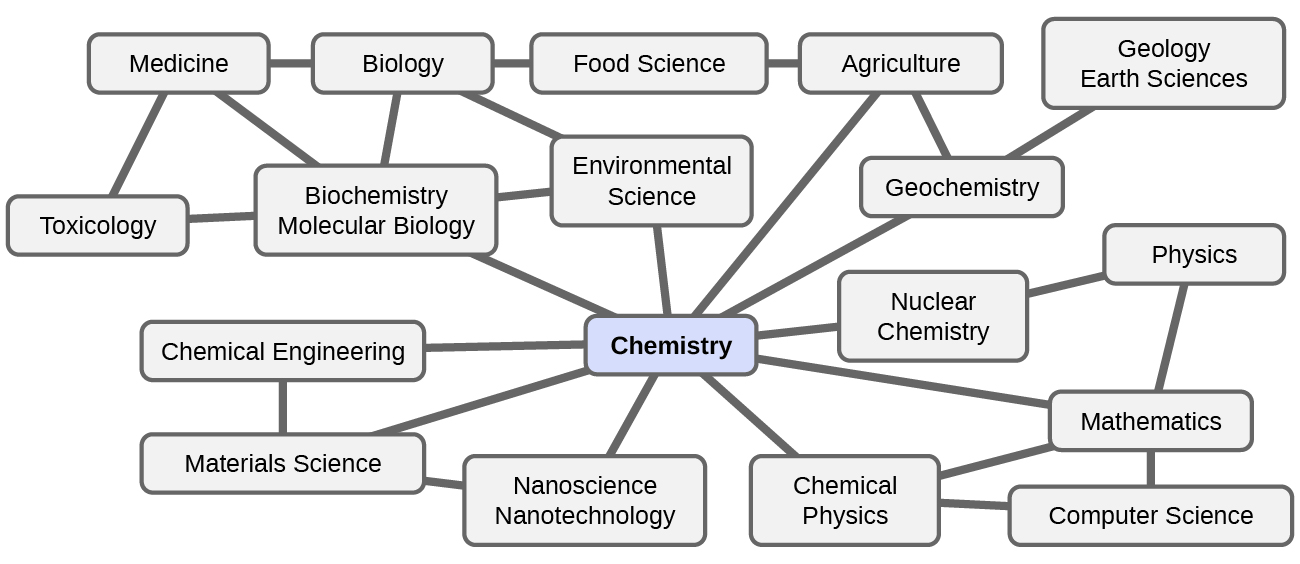
What are some changes in matter that are essential to daily life? Digesting and assimilating food, synthesizing polymers that are used to make clothing, containers, cookware, and credit cards, and refining crude oil into gasoline and other products are just a few examples. As you proceed through this course, you will discover many different examples of changes in the composition and structure of matter, how to classify these changes and how they occurred, their causes, the changes in energy that accompany them, and the principles and laws involved. As you learn about these things, you will be learning chemistry    , the study of the composition, properties, and interactions of matter. The practice of chemistry is not limited to chemistry books or laboratories: It happens whenever someone is involved in changes in matter or in conditions that may lead to such changes.

The scientific method

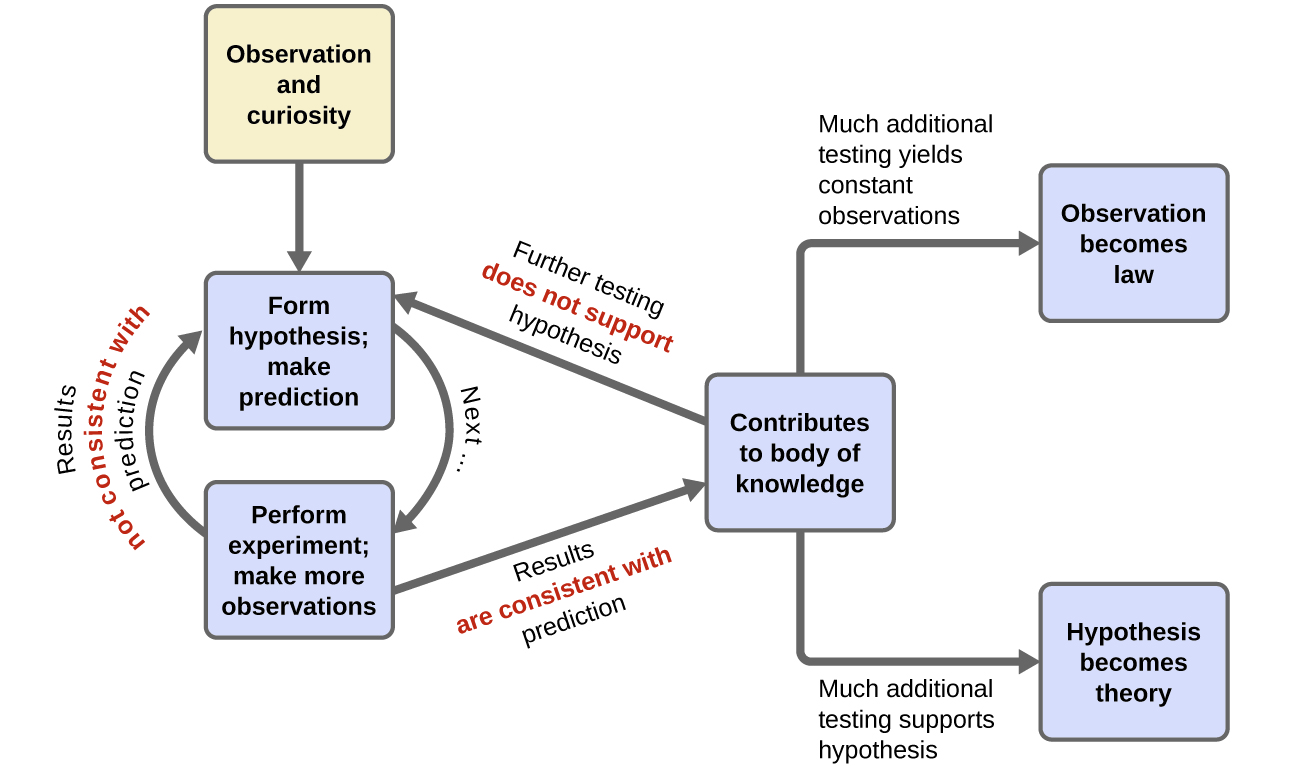
Chemistry is a science based on observation and experimentation. Doing chemistry involves attempting to answer questions and explain observations in terms of the laws and theories of chemistry, using procedures that are accepted by the scientific community. There is no single route to answering a question or explaining an observation, but there is an aspect common to every approach: Each uses knowledge based on experiments that can be reproduced to verify the results. Some routes involve a hypothesis    , a tentative explanation of observations that acts as a guide for gathering and checking information. We test a hypothesis by experimentation, calculation, and/or comparison with the experiments of others and then refine it as needed.

Some hypotheses are attempts to explain the behavior that is summarized in laws. The laws of science summarize a vast number of experimental observations, and describe or predict some facet of the natural world. If such a hypothesis turns out to be capable of explaining a large body of experimental data, it can reach the status of a theory. Scientific theories are well-substantiated, comprehensive, testable explanations of particular aspects of nature. Theories are accepted because they provide satisfactory explanations, but they can be modified if new data become available. The path of discovery that leads from question and observation to law or hypothesis to theory, combined with experimental verification of the hypothesis and any necessary modification of the theory, is called the scientific method    ( [link] ).

In this flowchart, the observation and curiosity box has an arrow pointing to a box labeled form hypothesis; make prediction. A curved arrow labeled next connects this box to a box labeled perform experiment; make more observations. Another arrow points back to the box that says form hypothesis; make prediction. This arrow is labeled results not consistent with prediction. Another arrow, labeled results are consistent with prediction points from the perform experiment box to a box labeled contributes to body of knowledge. However, an arrow also points from contributes to body of knowledge back to the form hypothesis; make prediction box. This arrow is labeled further testing does not support hypothesis. There are also two other arrows leading out from contributes to body of knowledge. One arrow is labeled much additional testing yields constant observations. This leads to the observation becomes law box. The other arrow is labeled much additional testing supports hypothesis. This arrow leads to the hypothesis becomes theory box.
The scientific method follows a process similar to the one shown in this diagram. All the key components are shown, in roughly the right order. Scientific progress is seldom neat and clean: It requires open inquiry and the reworking of questions and ideas in response to findings.

The domains of chemistry

Chemists study and describe the behavior of matter and energy in three different domains: macroscopic, microscopic, and symbolic. These domains provide different ways of considering and describing chemical behavior.

Questions & Answers

differentiate between demand and supply giving examples
Lambiv Reply
differentiated between demand and supply using examples
Lambiv
what is labour ?
Lambiv
how will I do?
Venny Reply
how is the graph works?I don't fully understand
Rezat Reply
information
Eliyee
devaluation
Eliyee
t
WARKISA
hi guys good evening to all
Lambiv
multiple choice question
Aster Reply
appreciation
Eliyee
explain perfect market
Lindiwe Reply
In economics, a perfect market refers to a theoretical construct where all participants have perfect information, goods are homogenous, there are no barriers to entry or exit, and prices are determined solely by supply and demand. It's an idealized model used for analysis,
Ezea
What is ceteris paribus?
Shukri Reply
other things being equal
AI-Robot
When MP₁ becomes negative, TP start to decline. Extuples Suppose that the short-run production function of certain cut-flower firm is given by: Q=4KL-0.6K2 - 0.112 • Where is quantity of cut flower produced, I is labour input and K is fixed capital input (K-5). Determine the average product of lab
Kelo
Extuples Suppose that the short-run production function of certain cut-flower firm is given by: Q=4KL-0.6K2 - 0.112 • Where is quantity of cut flower produced, I is labour input and K is fixed capital input (K-5). Determine the average product of labour (APL) and marginal product of labour (MPL)
Kelo
yes,thank you
Shukri
Can I ask you other question?
Shukri
what is monopoly mean?
Habtamu Reply
What is different between quantity demand and demand?
Shukri Reply
Quantity demanded refers to the specific amount of a good or service that consumers are willing and able to purchase at a give price and within a specific time period. Demand, on the other hand, is a broader concept that encompasses the entire relationship between price and quantity demanded
Ezea
ok
Shukri
how do you save a country economic situation when it's falling apart
Lilia Reply
what is the difference between economic growth and development
Fiker Reply
Economic growth as an increase in the production and consumption of goods and services within an economy.but Economic development as a broader concept that encompasses not only economic growth but also social & human well being.
Shukri
production function means
Jabir
What do you think is more important to focus on when considering inequality ?
Abdisa Reply
any question about economics?
Awais Reply
sir...I just want to ask one question... Define the term contract curve? if you are free please help me to find this answer 🙏
Asui
it is a curve that we get after connecting the pareto optimal combinations of two consumers after their mutually beneficial trade offs
Awais
thank you so much 👍 sir
Asui
In economics, the contract curve refers to the set of points in an Edgeworth box diagram where both parties involved in a trade cannot be made better off without making one of them worse off. It represents the Pareto efficient allocations of goods between two individuals or entities, where neither p
Cornelius
In economics, the contract curve refers to the set of points in an Edgeworth box diagram where both parties involved in a trade cannot be made better off without making one of them worse off. It represents the Pareto efficient allocations of goods between two individuals or entities,
Cornelius
Suppose a consumer consuming two commodities X and Y has The following utility function u=X0.4 Y0.6. If the price of the X and Y are 2 and 3 respectively and income Constraint is birr 50. A,Calculate quantities of x and y which maximize utility. B,Calculate value of Lagrange multiplier. C,Calculate quantities of X and Y consumed with a given price. D,alculate optimum level of output .
Feyisa Reply
Answer
Feyisa
c
Jabir
the market for lemon has 10 potential consumers, each having an individual demand curve p=101-10Qi, where p is price in dollar's per cup and Qi is the number of cups demanded per week by the i th consumer.Find the market demand curve using algebra. Draw an individual demand curve and the market dema
Gsbwnw Reply
suppose the production function is given by ( L, K)=L¼K¾.assuming capital is fixed find APL and MPL. consider the following short run production function:Q=6L²-0.4L³ a) find the value of L that maximizes output b)find the value of L that maximizes marginal product
Abdureman
types of unemployment
Yomi Reply
What is the difference between perfect competition and monopolistic competition?
Mohammed
Got questions? Join the online conversation and get instant answers!
Jobilize.com Reply
Practice Key Terms 8

Get Jobilize Job Search Mobile App in your pocket Now!

Get it on Google Play Download on the App Store Now


Source:  OpenStax, Chemistry. OpenStax CNX. May 20, 2015 Download for free at http://legacy.cnx.org/content/col11760/1.9
Google Play and the Google Play logo are trademarks of Google Inc.

Notification Switch

Would you like to follow the 'Chemistry' conversation and receive update notifications?

Ask