<< Chapter < Page Chapter >> Page >
Three rows labeled a, b, and c are shown and each contains rectangles with two sides where the left side is labeled, “A,” and “B,” and the right is labeled, “C,” and “D.” Row a has three rectangles where the first has a dot above and below the letter A, the second has a dot above the A and B, and the third which has a dot above and below the letter B. Row b has four rectangles; the first has a dot above A and C, the second has a dot above A and D, the third has a dot above B and C and the fourth has a dot above B and D. Row c has three rectangles; the first has a dot above and below the letter C, the second has a dot above C and D and the third has a dot above and below the letter D.
This shows a microstate model describing the flow of heat from a hot object to a cold object. (a) Before the heat flow occurs, the object comprised of particles A and B contains both units of energy and as represented by a distribution of three microstates. (b) If the heat flow results in an even dispersal of energy (one energy unit transferred), a distribution of four microstates results. (c) If both energy units are transferred, the resulting distribution has three microstates.

Determination of δ S

Consider the system shown here. What is the change in entropy for a process that converts the system from distribution (a) to (c)?

A diagram shows one rectangle with two sides that has four dots, red, green, yellow and blue written on the left side. A right-facing arrow leads to six more two-sided rectangles, each with two dots on the left and right sides. The first rectangle has a red and green dot on the left and a blue and yellow on the right, while the second shows a red and blue on the left and a green and yellow on the right. The third rectangle has a red and yellow dot on the left and a blue and green on the right, while the fourth shows a green and blue on the left and a red and yellow on the right. The fifth rectangle has a yellow and green dot on the left and a blue and red on the right, while the sixth shows a yellow and blue on the left and a green and red on the right.

Solution

We are interested in the following change:

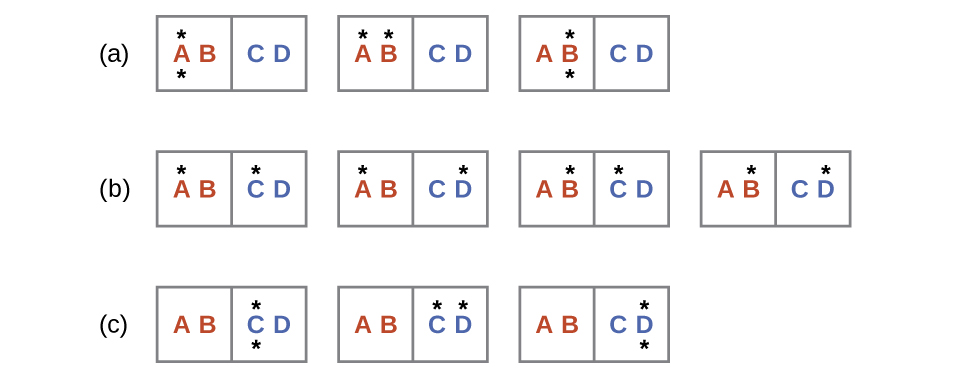
The initial number of microstates is one, the final six:

Δ S = k ln W c W a = 1.38 × 10 −23 J/K × ln 6 1 = 2.47 × 10 −23 J/K

The sign of this result is consistent with expectation; since there are more microstates possible for the final state than for the initial state, the change in entropy should be positive.

Check your learning

Consider the system shown in [link] . What is the change in entropy for the process where all the energy is transferred from the hot object ( AB ) to the cold object ( CD )?

Answer:

0 J/K

Got questions? Get instant answers now!

Predicting the sign of δ S

The relationships between entropy, microstates, and matter/energy dispersal described previously allow us to make generalizations regarding the relative entropies of substances and to predict the sign of entropy changes for chemical and physical processes. Consider the phase changes illustrated in [link] . In the solid phase, the atoms or molecules are restricted to nearly fixed positions with respect to each other and are capable of only modest oscillations about these positions. With essentially fixed locations for the system’s component particles, the number of microstates is relatively small. In the liquid phase, the atoms or molecules are free to move over and around each other, though they remain in relatively close proximity to one another. This increased freedom of motion results in a greater variation in possible particle locations, so the number of microstates is correspondingly greater than for the solid. As a result, S liquid > S solid and the process of converting a substance from solid to liquid (melting) is characterized by an increase in entropy, Δ S >0. By the same logic, the reciprocal process (freezing) exhibits a decrease in entropy, Δ S <0.

Three stoppered flasks are shown with right and left-facing arrows in between each; the first is labeled above as, “delta S greater than 0,” and below as, “delta S less than 0,” while the second is labeled above as, “delta S greater than 0,” and below as, “delta S less than 0.” A long, right-facing arrow is drawn above all the flasks and labeled, “Increasing entropy.” The left flask contains twenty-seven particles arranged in a cube in the bottom of the flask and is labeled, “Crystalline solid,” below. The middle flask contains twenty-seven particles dispersed randomly in the bottom of the flask and is labeled, “Liquid,” below. The right flask contains twenty-seven particles dispersed inside of the flask and moving rapidly and is labeled, “Gas,” below.
The entropy of a substance increases (Δ S >0) as it transforms from a relatively ordered solid, to a less-ordered liquid, and then to a still less-ordered gas. The entropy decreases (Δ S <0) as the substance transforms from a gas to a liquid and then to a solid.

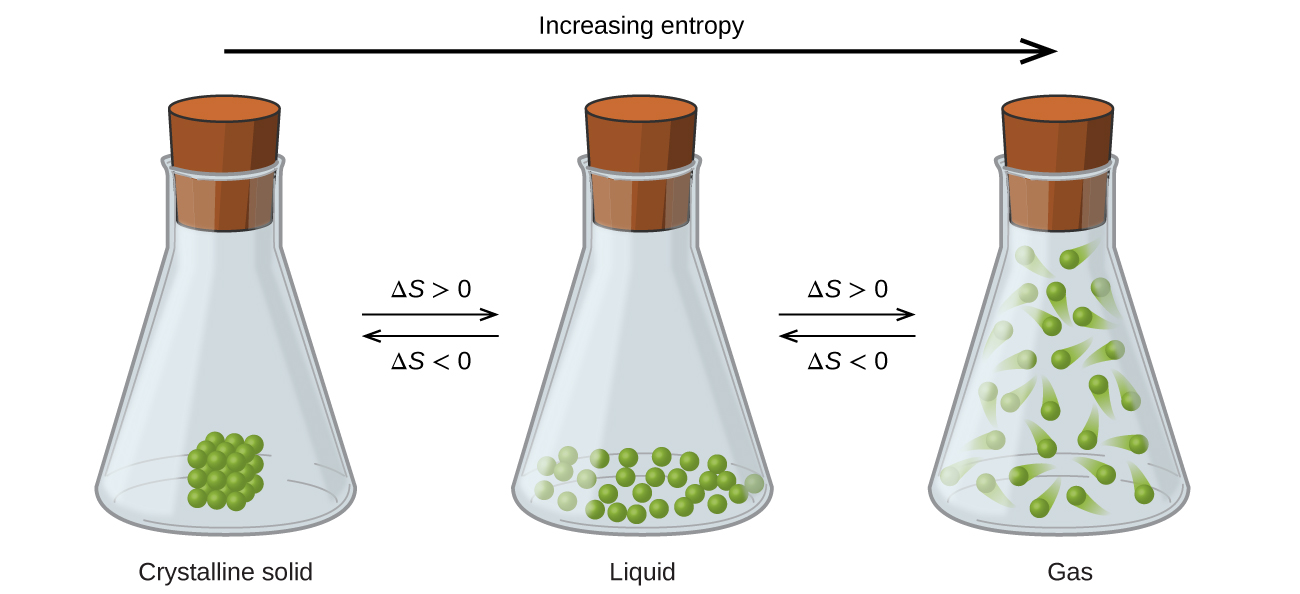
Now consider the vapor or gas phase. The atoms or molecules occupy a much greater volume than in the liquid phase; therefore each atom or molecule can be found in many more locations than in the liquid (or solid) phase. Consequently, for any substance, S gas > S liquid > S solid , and the processes of vaporization and sublimation likewise involve increases in entropy, Δ S >0. Likewise, the reciprocal phase transitions, condensation and deposition, involve decreases in entropy, Δ S <0.

Practice Key Terms 3

Get Jobilize Job Search Mobile App in your pocket Now!

Get it on Google Play Download on the App Store Now


Source:  OpenStax, Chemistry. OpenStax CNX. May 20, 2015 Download for free at http://legacy.cnx.org/content/col11760/1.9
Google Play and the Google Play logo are trademarks of Google Inc.

Notification Switch

Would you like to follow the 'Chemistry' conversation and receive update notifications?

Ask