<< Chapter < Page Chapter >> Page >

Phase diagram for an aqueous solution of a nonelectrolyte

The colligative effects on vapor pressure, boiling point, and freezing point described in the previous section are conveniently summarized by comparing the phase diagrams for a pure liquid and a solution derived from that liquid. Phase diagrams for water and an aqueous solution are shown in [link] .
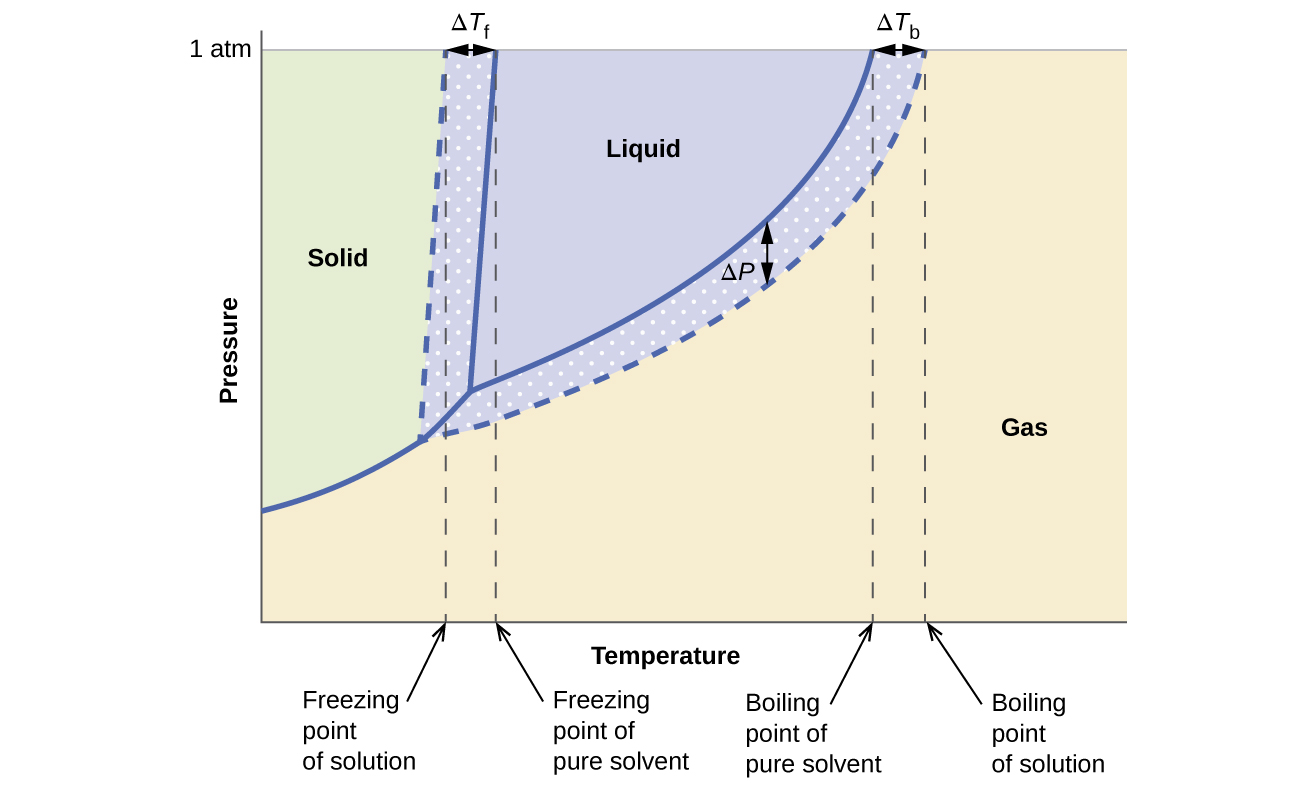
This phase diagram indicates the pressure in atmospheres of water and a solution at various temperatures. The graph shows the freezing point of water and the freezing point of the solution, with the difference between these two values identified as delta T subscript f. The graph shows the boiling point of water and the boiling point of the solution, with the difference between these two values identified as delta T subscript b. Similarly, the difference in the pressure of water and the solution at the boiling point of water is shown and identified as delta P. This difference in pressure is labeled vapor pressure lowering. The lower level of the vapor pressure curve for the solution as opposed to that of pure water shows vapor pressure lowering in the solution. Background colors on the diagram indicate the presence of water and the solution in the solid state to the left, liquid state in the central upper region, and gas to the right.
These phase diagrams show water (solid curves) and an aqueous solution of nonelectrolyte (dashed curves).

The liquid-vapor curve for the solution is located beneath the corresponding curve for the solvent, depicting the vapor pressure lowering , Δ P , that results from the dissolution of nonvolatile solute. Consequently, at any given pressure, the solution’s boiling point is observed at a higher temperature than that for the pure solvent, reflecting the boiling point elevation, Δ T b , associated with the presence of nonvolatile solute. The solid-liquid curve for the solution is displaced left of that for the pure solvent, representing the freezing point depression, Δ T b , that accompanies solution formation. Finally, notice that the solid-gas curves for the solvent and its solution are identical. This is the case for many solutions comprising liquid solvents and nonvolatile solutes. Just as for vaporization, when a solution of this sort is frozen, it is actually just the solvent molecules that undergo the liquid-to-solid transition, forming pure solid solvent that excludes solute species. The solid and gaseous phases, therefore, are composed solvent only, and so transitions between these phases are not subject to colligative effects.

Osmosis and osmotic pressure of solutions

A number of natural and synthetic materials exhibit selective permeation , meaning that only molecules or ions of a certain size, shape, polarity, charge, and so forth, are capable of passing through (permeating) the material. Biological cell membranes provide elegant examples of selective permeation in nature, while dialysis tubing used to remove metabolic wastes from blood is a more simplistic technological example. Regardless of how they may be fabricated, these materials are generally referred to as semipermeable membranes .

Consider the apparatus illustrated in [link] , in which samples of pure solvent and a solution are separated by a membrane that only solvent molecules may permeate. Solvent molecules will diffuse across the membrane in both directions. Since the concentration of solvent is greater in the pure solvent than the solution, these molecules will diffuse from the solvent side of the membrane to the solution side at a faster rate than they will in the reverse direction. The result is a net transfer of solvent molecules from the pure solvent to the solution. Diffusion-driven transfer of solvent molecules through a semipermeable membrane is a process known as osmosis    .
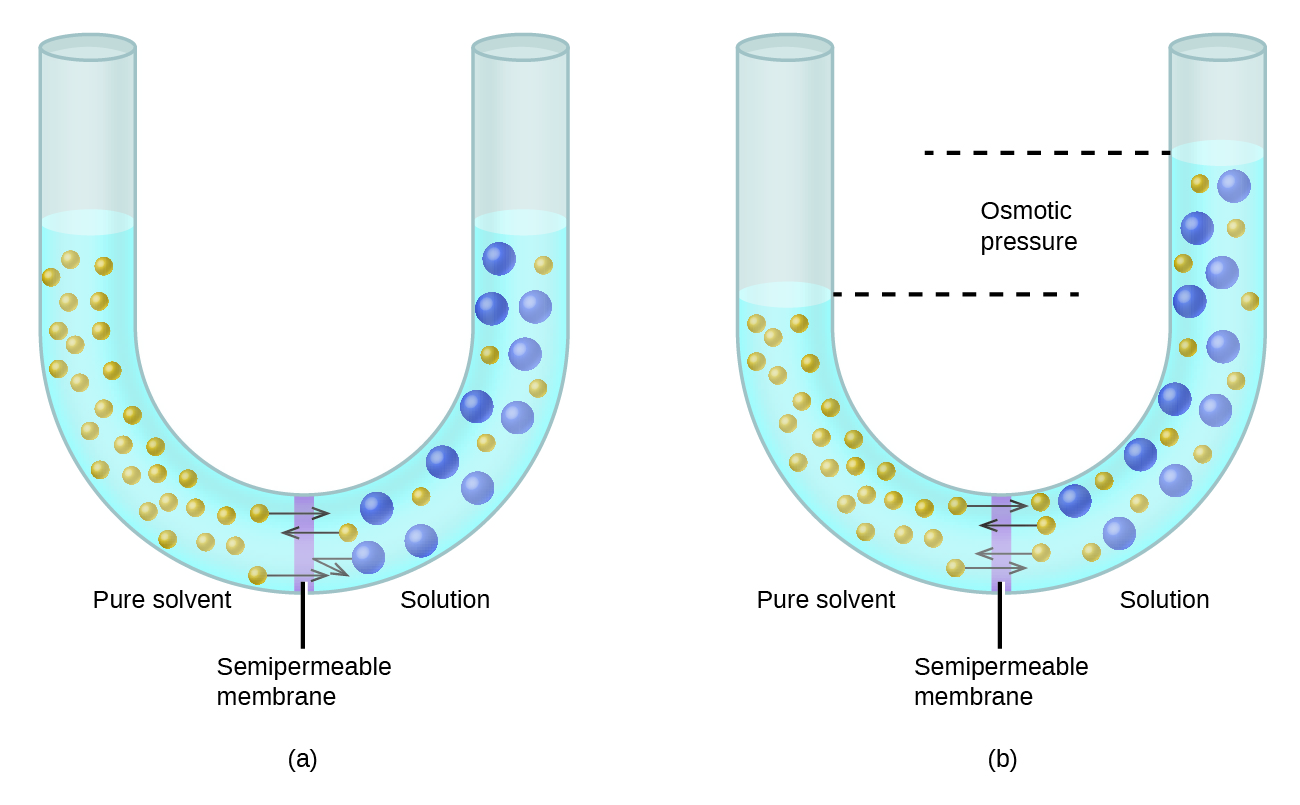
The figure shows two U shaped tubes with a semi permeable membrane placed at the base of the U. In figure a, pure solvent is present and indicated by small yellow spheres to the left of the membrane. To the right, a solution exists with larger blue spheres intermingled with some small yellow spheres. At the membrane, arrows pointing from three small yellow spheres on both sides of the membrane cross over the membrane. An arrow drawn from one of the large blue spheres does not cross the membrane, but rather is reflected back from the surface of the membrane. The levels of liquid in both sides of the U shaped tube are equal. In figure b, arrows again point from small yellow spheres across the semipermeable membrane from both sides. This diagram shows the level of liquid in the left, pure solvent, side to be significantly lower than the liquid level on the right. Dashed lines are drawn from these two liquid levels into the middle of the U-shaped tube and between them is the term osmotic pressure.
Osmosis results in the transfer of solvent molecules from a sample of low (or zero) solute concentration to a sample of higher solute concentration.

When osmosis is carried out in an apparatus like that shown in [link] , the volume of the solution increases as it becomes diluted by accumulation of solvent. This causes the level of the solution to rise, increasing its hydrostatic pressure (due to the weight of the column of solution in the tube) and resulting in a faster transfer of solvent molecules back to the pure solvent side. When the pressure reaches a value that yields a reverse solvent transfer rate equal to the osmosis rate, bulk transfer of solvent ceases. This pressure is called the osmotic pressure ( Π )    of the solution. The osmotic pressure of a dilute solution is related to its solute molarity, M , and absolute temperature, T , according to the equation

Questions & Answers

it is the relatively stable flow of income
Chidubem Reply
what is circular flow of income
Divine Reply
branches of macroeconomics
SHEDRACK Reply
what is Flexible exchang rate?
poudel Reply
is gdp a reliable measurement of wealth
Atega Reply
introduction to econometrics
Husseini Reply
Hi
mostafa
hi
LEMLEM
hello
Sammol
hi
Mahesh
bi
Ruqayat
hi
Ruqayat
Hi fellas
Nyawa
hey
Sammol
hi
God
hello
Jahara
Good morning
Jorge
hi
abubakar
hi
Nmesoma
hi
Mahesh
Hi
Tom
Why is unemployment rate never zero at full employment?
Priyanka Reply
bcoz of existence of frictional unemployment in our economy.
Umashankar
what is flexible exchang rate?
poudel
due to existence of the pple with disabilities
Abdulraufu
the demand of a good rises, causing the demand for another good to fall
Rushawn Reply
is it possible to leave every good at the same level
Joseph
I don't think so. because check it, if the demand for chicken increases, people will no longer consume fish like they used to causing a fall in the demand for fish
Anuolu
is not really possible to let the value of a goods to be same at the same time.....
Salome
Suppose the inflation rate is 6%, does it mean that all the goods you purchase will cost 6% more than previous year? Provide with reasoning.
Geetha Reply
Not necessarily. To measure the inflation rate economists normally use an averaged price index of a basket of certain goods. So if you purchase goods included in the basket, you will notice that you pay 6% more, otherwise not necessarily.
Waeth
discus major problems of macroeconomics
Alii Reply
what is the problem of macroeconomics
Yoal
Economic growth Stable prices and low unemployment
Ephraim
explain inflationcause and itis degre
Miresa Reply
what is inflation
Getu
increase in general price levels
WEETO
Good day How do I calculate this question: C= 100+5yd G= 2000 T= 2000 I(planned)=200. Suppose the actual output is 3000. What is the level of planned expenditures at this level of output?
Chisomo Reply
how to calculate actual output?
Chisomo
how to calculate the equilibrium income
Beshir
Criteria for determining money supply
Thapase Reply
who we can define macroeconomics in one line
Muhammad
Aggregate demand
Mohammed
C=k100 +9y and i=k50.calculate the equilibrium level of output
Mercy Reply
Hi
Isiaka
Hi
Geli
hy
Man
👋
Bahunda
hy how are you?
Man
ys
Amisha
how are you guys
Sekou
f9 guys
Amisha
how are you guys
Sekou
ys am also fine
Amisha
fine and you guys
Geli
from Nepal
Amisha
nawalparasi district from belatari
Amisha
nd u
Amisha
I am Camara from Guinea west Africa... happy to meet you guys here
Sekou
ma management ho
Amisha
ahile becheclor ho
Amisha
hjr ktm bta ho ani k kaam grnu hunxa tw
Amisha
belatari
Amisha
1st year ho
Amisha
nd u
Amisha
ahh
Amisha
kaha biratnagar
Amisha
ys
Amisha
kina k vo
Amisha
money as unit of account means what?
Kalombe
A unit of account is something that can be used to value goods and services and make calculations
Jim
all of you please speak in English I can't understand you're language
Muhammad
I want to know how can we define macroeconomics in one line
Muhammad
it must be .9 or 0.9 no Mpc is greater than 1 Y=100+.9Y+50 Y-.9Y=150 0.1Y/0.1=150/0.1 Y=1500
Kalombe
Mercy is it clear?😋
Kalombe
hi can someone help me on this question If a negative shocks shifts the IS curve to the left, what type of policy do you suggest so as to stabilize the level of output? discuss your answer using appropriate graph.
Galge Reply
if interest rate is increased this will will reduce the level of income shifting the curve to the left ◀️
Kalombe
Got questions? Join the online conversation and get instant answers!
Jobilize.com Reply

Get Jobilize Job Search Mobile App in your pocket Now!

Get it on Google Play Download on the App Store Now


Source:  OpenStax, Chemistry. OpenStax CNX. May 20, 2015 Download for free at http://legacy.cnx.org/content/col11760/1.9
Google Play and the Google Play logo are trademarks of Google Inc.

Notification Switch

Would you like to follow the 'Chemistry' conversation and receive update notifications?

Ask