<< Chapter < Page Chapter >> Page >
This figure shows 3 pairs of pistons and cylinders. In a, which is labeled, “Charles’s Law,” the piston is positioned for the first cylinder so that just over half of the available volume contains 6 purple spheres with trails behind them. The trails indicate movement. Orange dashes extend from the interior surface of the cylinder where the spheres have collided. This cylinder is labeled, “Baseline.” In the second cylinder, the piston is in the same position, and the label, “Heat” is indicated in red capitalized text. Four red arrows with wavy stems are pointing upward to the base of the cylinder. The six purple spheres have longer trails behind them and the number of orange dashes indicating points of collision with the container walls has increased. A rectangle beneath the diagram states, “Temperature increased, Volume constant equals Increased pressure.” In b, which is labeled, “Boyle’s Law,” the first, baseline cylinder shown is identical to the first cylinder in a. In the second cylinder, the piston has been moved, decreasing the volume available to the 6 purple spheres to half of the initial volume. The six purple spheres have longer trails behind them and the number of orange dashes indicating points of collision with the container walls has increased. This second cylinder is labeled, “Volume decreased.” A rectangle beneath the diagram states, “Volume decreased, Wall area decreased equals Increased pressure.” In c, which is labeled “Avogadro’s Law,” the first, baseline cylinder shown is identical to the first cylinder in a. In the second cylinder, the number of purple spheres has changed from 6 to 12 and volume has doubled. This second cylinder is labeled “Increased gas.” A rectangle beneath the diagram states, “At constant pressure, More gas molecules added equals Increased volume.”
(a) When gas temperature increases, gas pressure increases due to increased force and frequency of molecular collisions. (b) When volume decreases, gas pressure increases due to increased frequency of molecular collisions. (c) When the amount of gas increases at a constant pressure, volume increases to yield a constant number of collisions per unit wall area per unit time.

Molecular velocities and kinetic energy

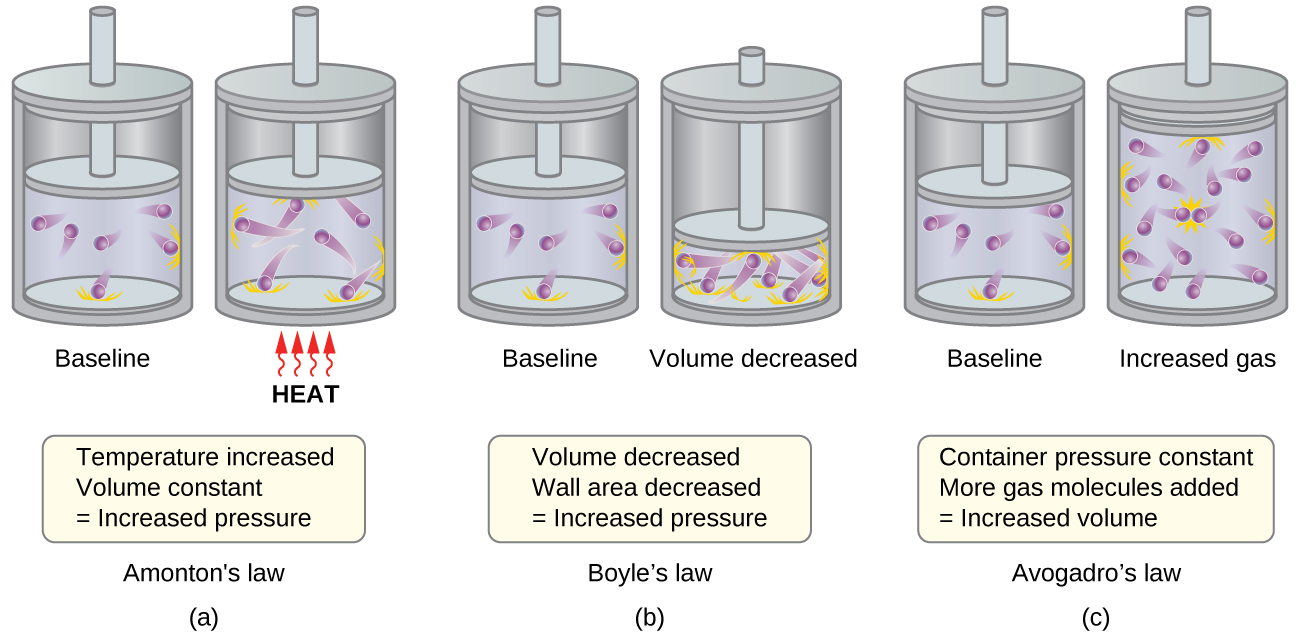
The previous discussion showed that the KMT qualitatively explains the behaviors described by the various gas laws. The postulates of this theory may be applied in a more quantitative fashion to derive these individual laws. To do this, we must first look at velocities and kinetic energies of gas molecules, and the temperature of a gas sample.

In a gas sample, individual molecules have widely varying speeds; however, because of the vast number of molecules and collisions involved, the molecular speed distribution and average speed are constant. This molecular speed distribution is known as a Maxwell-Boltzmann distribution, and it depicts the relative numbers of molecules in a bulk sample of gas that possesses a given speed ( [link] ).

A graph is shown. The horizontal axis is labeled, “Velocity v ( m divided by s ).” This axis is marked by increments of 20 beginning at 0 and extending up to 120. The vertical axis is labeled, “Fraction of molecules.” A positively or right-skewed curve is shown in red which begins at the origin and approaches the horizontal axis around 120 m per s. At the peak of the curve, a point is indicated with a black dot and is labeled, “v subscript p.” A vertical dashed line extends from this point to the horizontal axis at which point the intersection is labeled, “v subscript p.” Slightly to the right of the peak a second black dot is placed on the curve. This point is labeled, “v subscript r m s.” A vertical dashed line extends from this point to the horizontal axis at which point the intersection is labeled, “v subscript r m s.” The label, “O subscript 2 at T equals 300 K” appears in the open space to the right of the curve.
The molecular speed distribution for oxygen gas at 300 K is shown here. Very few molecules move at either very low or very high speeds. The number of molecules with intermediate speeds increases rapidly up to a maximum, which is the most probable speed, then drops off rapidly. Note that the most probable speed, ν p , is a little less than 400 m/s, while the root mean square speed, u rms , is closer to 500 m/s.

The kinetic energy (KE) of a particle of mass ( m ) and speed ( u ) is given by:

KE = 1 2 m u 2

Expressing mass in kilograms and speed in meters per second will yield energy values in units of joules (J = kg m 2 s –2 ). To deal with a large number of gas molecules, we use averages for both speed and kinetic energy. In the KMT, the root mean square velocity of a particle, u rms , is defined as the square root of the average of the squares of the velocities with n = the number of particles:

u r m s = u 2 ¯ = u 1 2 + u 2 2 + u 3 2 + u 4 2 + n

The average kinetic energy, KE avg , is then equal to:

KE avg = 1 2 m u rms 2

The KE avg of a collection of gas molecules is also directly proportional to the temperature of the gas and may be described by the equation:

KE avg = 3 2 R T

where R is the gas constant and T is the kelvin temperature. When used in this equation, the appropriate form of the gas constant is 8.314 J/K (8.314 kg m 2 s –2 K –1 ). These two separate equations for KE avg may be combined and rearranged to yield a relation between molecular speed and temperature:

1 2 m u rms 2 = 3 2 R T
u rms = 3 R T m

Calculation of u rms

Calculate the root-mean-square velocity for a nitrogen molecule at 30 °C.

Solution

Convert the temperature into Kelvin:

30 °C + 273 = 303 K

Determine the mass of a nitrogen molecule in kilograms:

28.0 g 1 mol × 1 kg 1000 g = 0.028 kg/mol

Replace the variables and constants in the root-mean-square velocity equation, replacing Joules with the equivalent kg m 2 s –2 :

u rms = 3 R T m
u r m s = 3 ( 8.314 J/mol K ) ( 303 K ) ( 0.028 kg/mol ) = 2.70 × 10 5 m 2 s 2 = 519 m/s

Check your learning

Calculate the root-mean-square velocity for an oxygen molecule at –23 °C.

Answer:

441 m/s

Got questions? Get instant answers now!

Questions & Answers

Ayele, K., 2003. Introductory Economics, 3rd ed., Addis Ababa.
Widad Reply
can you send the book attached ?
Ariel
?
Ariel
What is economics
Widad Reply
the study of how humans make choices under conditions of scarcity
AI-Robot
U(x,y) = (x×y)1/2 find mu of x for y
Desalegn Reply
U(x,y) = (x×y)1/2 find mu of x for y
Desalegn
what is ecnomics
Jan Reply
this is the study of how the society manages it's scarce resources
Belonwu
what is macroeconomic
John Reply
macroeconomic is the branch of economics which studies actions, scale, activities and behaviour of the aggregate economy as a whole.
husaini
etc
husaini
difference between firm and industry
husaini Reply
what's the difference between a firm and an industry
Abdul
firm is the unit which transform inputs to output where as industry contain combination of firms with similar production 😅😅
Abdulraufu
Suppose the demand function that a firm faces shifted from Qd  120 3P to Qd  90  3P and the supply function has shifted from QS  20  2P to QS 10  2P . a) Find the effect of this change on price and quantity. b) Which of the changes in demand and supply is higher?
Toofiq Reply
explain standard reason why economic is a science
innocent Reply
factors influencing supply
Petrus Reply
what is economic.
Milan Reply
scares means__________________ends resources. unlimited
Jan
economics is a science that studies human behaviour as a relationship b/w ends and scares means which have alternative uses
Jan
calculate the profit maximizing for demand and supply
Zarshad Reply
Why qualify 28 supplies
Milan
what are explicit costs
Nomsa Reply
out-of-pocket costs for a firm, for example, payments for wages and salaries, rent, or materials
AI-Robot
concepts of supply in microeconomics
David Reply
economic overview notes
Amahle Reply
identify a demand and a supply curve
Salome Reply
i don't know
Parul
there's a difference
Aryan
Demand curve shows that how supply and others conditions affect on demand of a particular thing and what percent demand increase whith increase of supply of goods
Israr
Hi Sir please how do u calculate Cross elastic demand and income elastic demand?
Abari
Got questions? Join the online conversation and get instant answers!
Jobilize.com Reply
Practice Key Terms 2

Get Jobilize Job Search Mobile App in your pocket Now!

Get it on Google Play Download on the App Store Now


Source:  OpenStax, Chemistry. OpenStax CNX. May 20, 2015 Download for free at http://legacy.cnx.org/content/col11760/1.9
Google Play and the Google Play logo are trademarks of Google Inc.

Notification Switch

Would you like to follow the 'Chemistry' conversation and receive update notifications?

Ask