<< Chapter < Page Chapter >> Page >
By the end of this section, you will be able to:
  • Outline the basic premise of crystal field theory (CFT)
  • Identify molecular geometries associated with various d-orbital splitting patterns
  • Predict electron configurations of split d orbitals for selected transition metal atoms or ions
  • Explain spectral and magnetic properties in terms of CFT concepts

The behavior of coordination compounds cannot be adequately explained by the same theories used for main group element chemistry. The observed geometries of coordination complexes are not consistent with hybridized orbitals on the central metal overlapping with ligand orbitals, as would be predicted by valence bond theory. The observed colors indicate that the d orbitals often occur at different energy levels rather than all being degenerate, that is, of equal energy, as are the three p orbitals. To explain the stabilities, structures, colors, and magnetic properties of transition metal complexes, a different bonding model has been developed. Just as valence bond theory explains many aspects of bonding in main group chemistry, crystal field theory is useful in understanding and predicting the behavior of transition metal complexes.

Crystal field theory

To explain the observed behavior of transition metal complexes (such as how colors arise), a model involving electrostatic interactions between the electrons from the ligands and the electrons in the unhybridized d orbitals of the central metal atom has been developed. This electrostatic model is crystal field theory    (CFT). It allows us to understand, interpret, and predict the colors, magnetic behavior, and some structures of coordination compounds of transition metals.

CFT focuses on the nonbonding electrons on the central metal ion in coordination complexes not on the metal-ligand bonds. Like valence bond theory, CFT tells only part of the story of the behavior of complexes. However, it tells the part that valence bond theory does not. In its pure form, CFT ignores any covalent bonding between ligands and metal ions. Both the ligand and the metal are treated as infinitesimally small point charges.

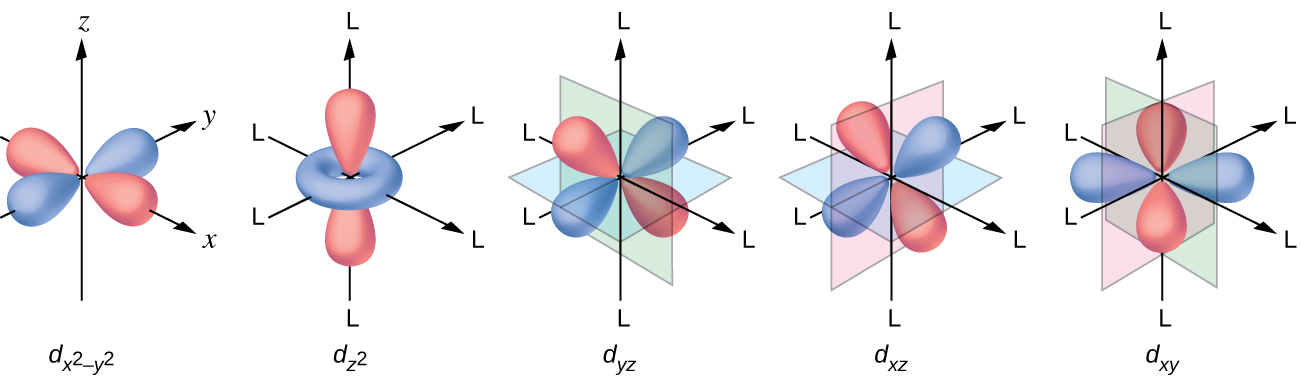
All electrons are negative, so the electrons donated from the ligands will repel the electrons of the central metal. Let us consider the behavior of the electrons in the unhybridized d orbitals in an octahedral complex. The five d orbitals consist of lobe-shaped regions and are arranged in space, as shown in [link] . In an octahedral complex, the six ligands coordinate along the axes.

This figure includes diagrams of five d orbitals. Each diagram includes three axes. The z-axis is vertical and is denoted with an upward pointing arrow. It is labeled “z” in the first diagram. Arrows similarly identify the x-axis with an arrow pointing from the rear left to the right front, diagonally across the figure and the y-axis with an arrow pointing from the left front diagonally across the figure to the right rear of the diagram. These axes are similarly labeled as “x” and “y.” In this first diagram, four orange balloon-like shapes extend from a point at the origin out along the x- and y- axes in positive and negative directions covering just over half the length of the positive and negative x- and y- axes. Beneath the diagram is the label, “d subscript ( x superscript 2 minus y superscript 2 ).” The second diagram just right of the first is similar except the x, y, and z labels have been replaced in each instance with the letter L. Only a pair of the orange balloon-like shapes are present and extend from the origin above and below along the vertical axis. An orange toroidal or donut shape is positioned around the origin, oriented through the x- and y- axes. This shape extends out to about a third of the length of the positive and negative regions of the x- and y- axes. This diagram is labeled, “d subscript ( z superscript 2 ).” The third through fifth diagrams, similar to the first, show four orange balloon-like shapes. These diagrams differ however in the orientation of the shapes along the axes and the x-, y-, and z-axis labels have each been replaced with the letter L. Planes are added to the figures to help show the orientation differences with these diagrams. In the third diagram, a green plane is oriented vertically through the length of the x-axis and a blue plane is oriented horizontally through the length of the y-axis. The balloon shapes extend from the origin to the spaces between the positive z- and negative y- axes, positive z- and positive y- axes, negative z- and negative y- axes, and negative z- and positive y- axes. This diagram is labeled, “d subscript ( y z ).” In the fourth diagram, a green plane is oriented vertically through the x- and y- axes and a blue plane is oriented horizontally through the length of the x-axis. The balloon shapes extend from the origin to the spaces between the positive z- and negative x- axes, positive z- and positive x- axes, negative z- and negative x- axes, and negative z- and positive x- axes. This diagram is labeled “d subscript ( x z ).” In the fifth diagram, a pink plane is oriented vertically through the length of the y-axis and a green plane is oriented vertically through the length of the x-axis. The balloon shapes extend from the origin to the spaces between the positive x- and negative y- axes, positive x- and positive y- axes, negative x- and negative y- axes, and negative x- and positive y- axes. This diagram is labeled, “d subscript ( x y ).”
The directional characteristics of the five d orbitals are shown here. The shaded portions indicate the phase of the orbitals. The ligands (L) coordinate along the axes. For clarity, the ligands have been omitted from the d x 2 y 2 orbital so that the axis labels could be shown.

In an uncomplexed metal ion in the gas phase, the electrons are distributed among the five d orbitals in accord with Hund's rule because the orbitals all have the same energy. However, when ligands coordinate to a metal ion, the energies of the d orbitals are no longer the same.

Questions & Answers

how do you get the 2/50
Abba Reply
number of sport play by 50 student construct discrete data
Aminu Reply
width of the frangebany leaves on how to write a introduction
Theresa Reply
Solve the mean of variance
Veronica Reply
Step 1: Find the mean. To find the mean, add up all the scores, then divide them by the number of scores. ... Step 2: Find each score's deviation from the mean. ... Step 3: Square each deviation from the mean. ... Step 4: Find the sum of squares. ... Step 5: Divide the sum of squares by n – 1 or N.
kenneth
what is error
Yakuba Reply
Is mistake done to something
Vutshila
Hy
anas
hy
What is the life teble
anas
hy
Jibrin
statistics is the analyzing of data
Tajudeen Reply
what is statics?
Zelalem Reply
how do you calculate mean
Gloria Reply
diveving the sum if all values
Shaynaynay
let A1,A2 and A3 events be independent,show that (A1)^c, (A2)^c and (A3)^c are independent?
Fisaye Reply
what is statistics
Akhisani Reply
data collected all over the world
Shaynaynay
construct a less than and more than table
Imad Reply
The sample of 16 students is taken. The average age in the sample was 22 years with astandard deviation of 6 years. Construct a 95% confidence interval for the age of the population.
Aschalew Reply
Bhartdarshan' is an internet-based travel agency wherein customer can see videos of the cities they plant to visit. The number of hits daily is a normally distributed random variable with a mean of 10,000 and a standard deviation of 2,400 a. what is the probability of getting more than 12,000 hits? b. what is the probability of getting fewer than 9,000 hits?
Akshay Reply
Bhartdarshan'is an internet-based travel agency wherein customer can see videos of the cities they plan to visit. The number of hits daily is a normally distributed random variable with a mean of 10,000 and a standard deviation of 2,400. a. What is the probability of getting more than 12,000 hits
Akshay
1
Bright
Sorry i want to learn more about this question
Bright
Someone help
Bright
a= 0.20233 b=0.3384
Sufiyan
a
Shaynaynay
How do I interpret level of significance?
Mohd Reply
It depends on your business problem or in Machine Learning you could use ROC- AUC cruve to decide the threshold value
Shivam
how skewness and kurtosis are used in statistics
Owen Reply
yes what is it
Taneeya
Got questions? Join the online conversation and get instant answers!
Jobilize.com Reply

Get Jobilize Job Search Mobile App in your pocket Now!

Get it on Google Play Download on the App Store Now


Source:  OpenStax, Chemistry. OpenStax CNX. May 20, 2015 Download for free at http://legacy.cnx.org/content/col11760/1.9
Google Play and the Google Play logo are trademarks of Google Inc.

Notification Switch

Would you like to follow the 'Chemistry' conversation and receive update notifications?

Ask