<< Chapter < Page Chapter >> Page >

Volumes of reacting gases

Ammonia is an important fertilizer and industrial chemical. Suppose that a volume of 683 billion cubic feet of gaseous ammonia, measured at 25 °C and 1 atm, was manufactured. What volume of H 2 ( g ), measured under the same conditions, was required to prepare this amount of ammonia by reaction with N 2 ?

N 2 ( g ) + 3 H 2 ( g ) 2 NH 3 ( g )

Solution

Because equal volumes of H 2 and NH 3 contain equal numbers of molecules and each three molecules of H 2 that react produce two molecules of NH 3 , the ratio of the volumes of H 2 and NH 3 will be equal to 3:2. Two volumes of NH 3 , in this case in units of billion ft 3 , will be formed from three volumes of H 2 :

683 billion ft 3 NH 3 × 3 billion ft 3 H 2 2 billion ft 3 NH 3 = 1.02 × 10 3 billion ft 3 H 2

The manufacture of 683 billion ft 3 of NH 3 required 1020 billion ft 3 of H 2 . (At 25 °C and 1 atm, this is the volume of a cube with an edge length of approximately 1.9 miles.)

Check your learning

What volume of O 2 ( g ) measured at 25 °C and 760 torr is required to react with 17.0 L of ethylene, C 2 H 4 ( g ), measured under the same conditions of temperature and pressure? The products are CO 2 and water vapor.

Answer:

51.0 L

Got questions? Get instant answers now!

Volume of gaseous product

What volume of hydrogen at 27 °C and 723 torr may be prepared by the reaction of 8.88 g of gallium with an excess of hydrochloric acid?

2 Ga ( s ) + 6 HCl ( a q ) 2 GaCl 3 ( a q ) + 3 H 2 ( g )

Solution

To convert from the mass of gallium to the volume of H 2 ( g ), we need to do something like this:

This figure shows four rectangles. The first is shaded yellow and is labeled “Mass of G a.” This rectangle is followed by an arrow pointing right to a second rectangle which is shaded pink and is labeled “Moles of G a.” This rectangle is followed by an arrow pointing right to a third rectangle which is shaded pink and is labeled “Moles of H subscript 2 ( g ).” This rectangle is followed by an arrow pointing right to a fourth rectangle which is shaded lavender and is labeled “Volume of H subscript 2 ( g ).”

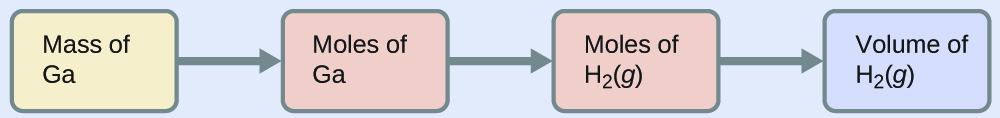
The first two conversions are:

8.88 g Ga × 1 mol Ga 69.723 g Ga × 3 mol H 2 2 mol Ga = 0.191 mol H 2

Finally, we can use the ideal gas law:

V H 2 = ( n R T P ) H 2 = 0.191 mol × 0.08206 L atm mol −1 K −1 × 300 K 0.951 atm = 4.94 L

Check your learning

Sulfur dioxide is an intermediate in the preparation of sulfuric acid. What volume of SO 2 at 343 °C and 1.21 atm is produced by burning l.00 kg of sulfur in oxygen?

Answer:

1.30 × 10 3 L

Got questions? Get instant answers now!

Greenhouse gases and climate change

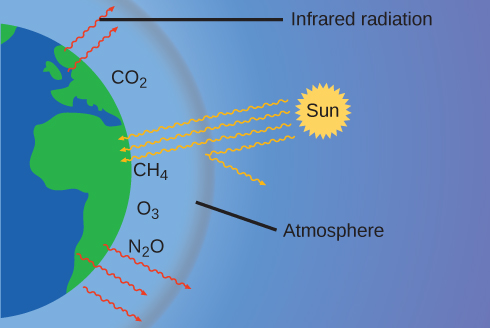
The thin skin of our atmosphere keeps the earth from being an ice planet and makes it habitable. In fact, this is due to less than 0.5% of the air molecules. Of the energy from the sun that reaches the earth, almost 1 3 is reflected back into space, with the rest absorbed by the atmosphere and the surface of the earth. Some of the energy that the earth absorbs is re-emitted as infrared (IR) radiation, a portion of which passes back out through the atmosphere into space. However, most of this IR radiation is absorbed by certain substances in the atmosphere, known as greenhouse gases, which re-emit this energy in all directions, trapping some of the heat. This maintains favorable living conditions—without atmosphere, the average global average temperature of 14 °C (57 °F) would be about –19 °C (–2 °F). The major greenhouse gases (GHGs) are water vapor, carbon dioxide, methane, and ozone. Since the Industrial Revolution, human activity has been increasing the concentrations of GHGs, which have changed the energy balance and are significantly altering the earth’s climate ( [link] ).

This diagram shows half of a two dimensional view of the earth in blue and green at the left of the image. A slight distance outside the hemisphere is a grey arc. A line segment connects the label “Atmosphere” to the region between the hemisphere and the grey arc. In this region, near the surface of the earth the chemical formulas C O subscript 2, C H subscript 3, and N subscript 2 O appear. Five red arrows formed from wavy lines extend from green regions on the earth out into and just beyond the region labeled “Atmosphere.” The label “Infrared radiation” points to one of these red arrows. At a fair distance outside of the grey arc appears a yellow circle with a jagged boundary. This circle is labeled “Sun.” From it extend yellow arrows with wavy lines which extend toward the earth. Three of the arrows extend to the green region on the earth. One of the arrows appears to be reflected off the grey arc, causing its path to turn away from the earth.
Greenhouse gases trap enough of the sun’s energy to make the planet habitable—this is known as the greenhouse effect. Human activities are increasing greenhouse gas levels, warming the planet and causing more extreme weather events.

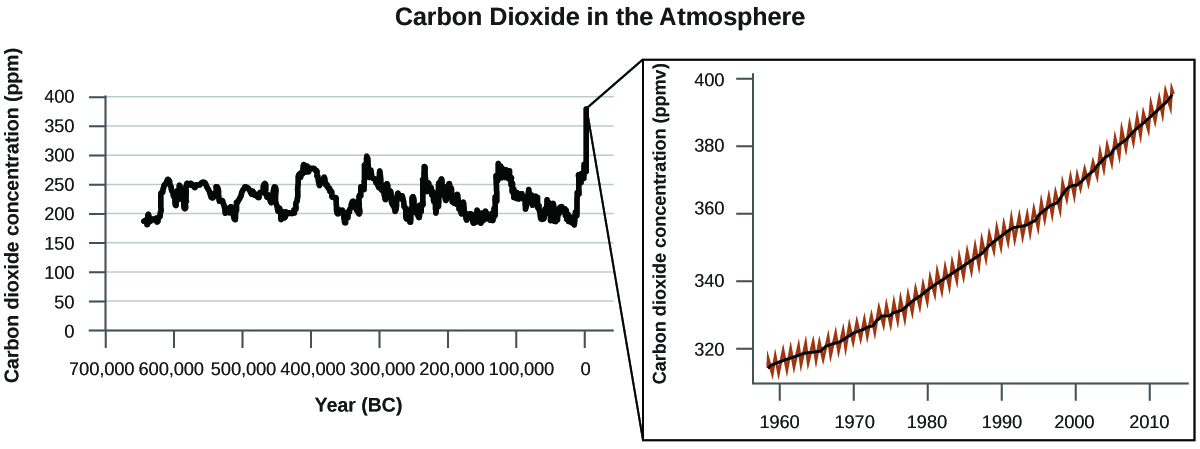
There is strong evidence from multiple sources that higher atmospheric levels of CO 2 are caused by human activity, with fossil fuel burning accounting for about 3 4 of the recent increase in CO 2 . Reliable data from ice cores reveals that CO 2 concentration in the atmosphere is at the highest level in the past 800,000 years; other evidence indicates that it may be at its highest level in 20 million years. In recent years, the CO 2 concentration has increased from historical levels of below 300 ppm to almost 400 ppm today ( [link] ).

This figure has the heading “Carbon Dioxide in the Atmosphere.” The first graph has a horizontal axis label “Year ( B C )” and a vertical axis label “Carbon dioxide concentration ( p p m ).” The horizontal axis labels begin at 700,000 on the left and increases by multiples of 100,000 up to 0 on the right. The vertical axis begins at 0 and increases by multiples of 50 extending up to 400. A jagged, cyclical pattern is shown that begins before 600,000 B C at under 200 p p m. Up to 0 B C values appear to vary cyclically up to a high of about 300 p p m. Extending beyond 0 B C to the right, the carbon dioxide concentration appears to be on a steady increase, having reached nearly 400 p p m in recent years. The second graph is shown to magnify the portion of the graph that is most recent. This graph begins just before the year 1960 and includes markings for multiples of 10 up to the year 2010. The vertical axis begins just below 320 p p m and includes markings for all multiples of 20 up to 400 p p m. A smooth black line is shown extending through a jagged red data pattern. The trend is a steady, nearly linear increase from the lower left to the upper right on the graph.
CO 2 levels over the past 700,000 years were typically from 200–300 ppm, with a steep, unprecedented increase over the past 50 years.
Practice Key Terms 4

Get Jobilize Job Search Mobile App in your pocket Now!

Get it on Google Play Download on the App Store Now


Source:  OpenStax, Chemistry. OpenStax CNX. May 20, 2015 Download for free at http://legacy.cnx.org/content/col11760/1.9
Google Play and the Google Play logo are trademarks of Google Inc.

Notification Switch

Would you like to follow the 'Chemistry' conversation and receive update notifications?

Ask