<< Chapter < Page Chapter >> Page >
By the end of this section, you will be able to:
  • Describe and explain the observed trends in atomic size, ionization energy, and electron affinity of the elements

The elements in groups (vertical columns) of the periodic table exhibit similar chemical behavior. This similarity occurs because the members of a group have the same number and distribution of electrons in their valence shells. However, there are also other patterns in chemical properties on the periodic table. For example, as we move down a group, the metallic character of the atoms increases. Oxygen, at the top of group 16 (6A), is a colorless gas; in the middle of the group, selenium is a semiconducting solid; and, toward the bottom, polonium is a silver-grey solid that conducts electricity.

As we go across a period from left to right, we add a proton to the nucleus and an electron to the valence shell with each successive element. As we go down the elements in a group, the number of electrons in the valence shell remains constant, but the principal quantum number increases by one each time. An understanding of the electronic structure of the elements allows us to examine some of the properties that govern their chemical behavior. These properties vary periodically as the electronic structure of the elements changes. They are (1) size (radius) of atoms and ions, (2) ionization energies, and (3) electron affinities.

Variation in covalent radius

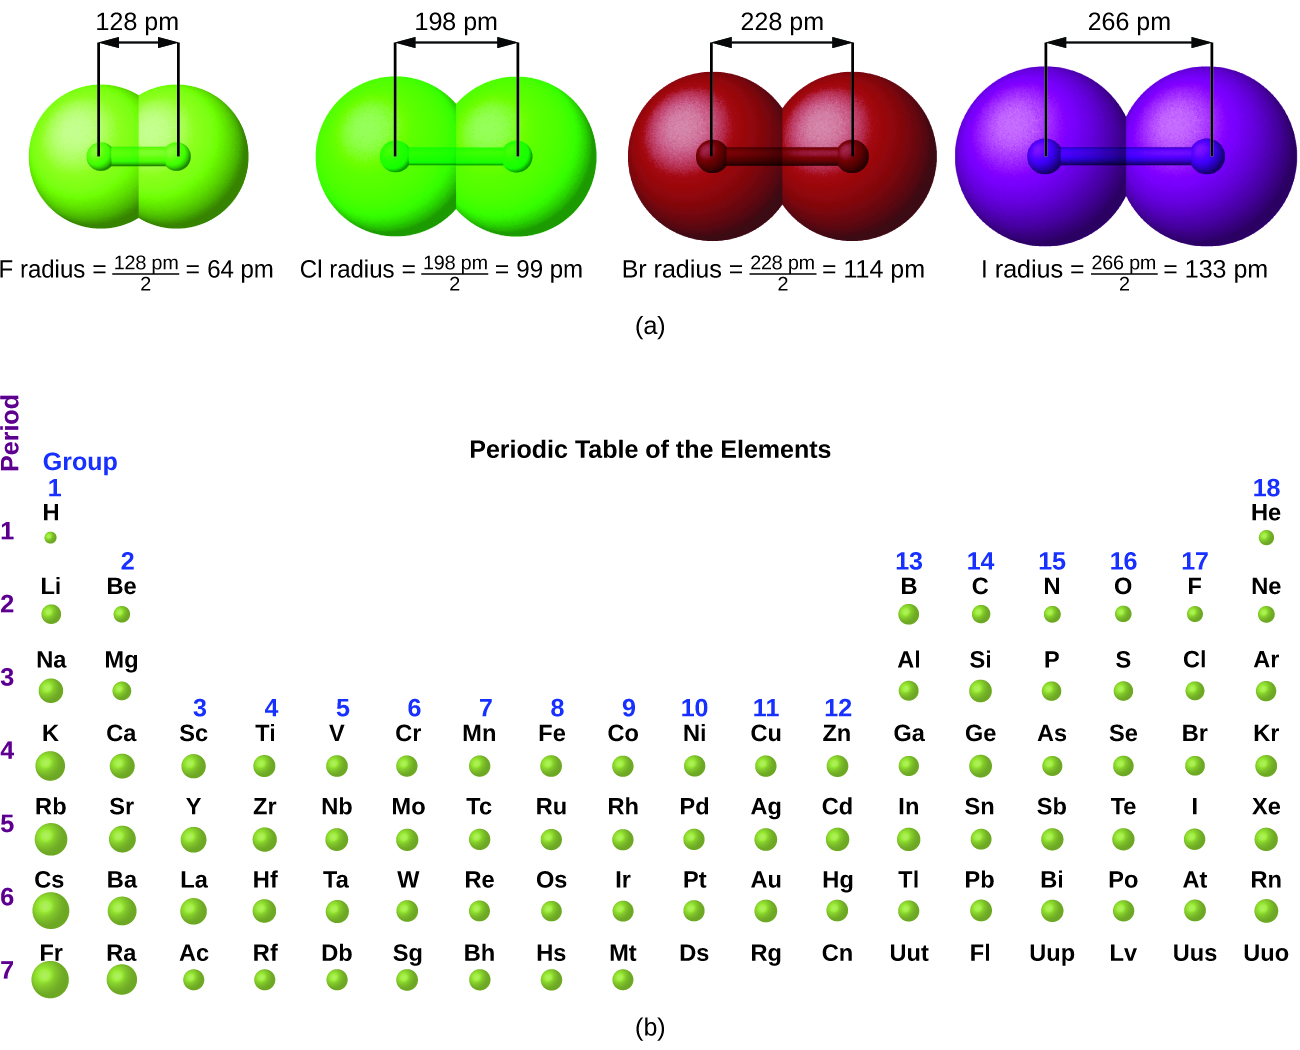
The quantum mechanical picture makes it difficult to establish a definite size of an atom. However, there are several practical ways to define the radius of atoms and, thus, to determine their relative sizes that give roughly similar values. We will use the covalent radius    ( [link] ), which is defined as one-half the distance between the nuclei of two identical atoms when they are joined by a covalent bond (this measurement is possible because atoms within molecules still retain much of their atomic identity). We know that as we scan down a group, the principal quantum number, n , increases by one for each element. Thus, the electrons are being added to a region of space that is increasingly distant from the nucleus. Consequently, the size of the atom (and its covalent radius) must increase as we increase the distance of the outermost electrons from the nucleus. This trend is illustrated for the covalent radii of the halogens in [link] and [link] . The trends for the entire periodic table can be seen in [link] .

Covalent Radii of the Halogen Group Elements
Atom Covalent radius (pm) Nuclear charge
F 64 +9
Cl 99 +17
Br 114 +35
I 133 +53
At 148 +85
This figure has two parts: a and b. In figure a, 4 diatomic molecules are shown to illustrate the method of determining the atomic radius of an atom. The first model, in light green, is used to find the F atom radius. Two spheres are pushed very tightly together. The distance between the centers of the two atoms is indicated above the diagram with a double headed arrow labeled, “128 p m.” The endpoints of this arrow connect to line segments that extend to the atomic radii below. Beneath the molecule is the label, “F radius equals 128 p m divided by 2 equals 64 p m.” The next three models are similarly used to show the atomic radii of additional atoms. The second diatomic molecule is in a darker shade of green. The distance between the radii is 198 p m. Beneath the molecule is the label, “C l radius equals 198 p m divided by 2 equals 99 pm.” The third diatomic molecule is in red. The distance between the radii is 228 p m. Beneath the molecule is the label, “B r radius equals 228 p m divided by 2 equals 114 pm.” The fourth diatomic molecule is in purple. The distance between the radii is 266 p m. Beneath the molecule is the label, “I radius equals 266 p m divided by 2 equals 133 p m.” In figure b, a periodic table layout is used to compare relative sizes of atoms using green spheres. No spheres are provided for the noble or inert gas, group 18 elements. General trends noted are increasing circle size moving from top to bottom in a group, with a general tendency toward increasing atomic radii toward the lower left corner of the periodic table.
(a) The radius of an atom is defined as one-half the distance between the nuclei in a molecule consisting of two identical atoms joined by a covalent bond. The atomic radius for the halogens increases down the group as n increases. (b) Covalent radii of the elements are shown to scale. The general trend is that radii increase down a group and decrease across a period.

Questions & Answers

differentiate between demand and supply giving examples
Lambiv Reply
differentiated between demand and supply using examples
Lambiv
what is labour ?
Lambiv
how will I do?
Venny Reply
how is the graph works?I don't fully understand
Rezat Reply
information
Eliyee
devaluation
Eliyee
t
WARKISA
hi guys good evening to all
Lambiv
multiple choice question
Aster Reply
appreciation
Eliyee
explain perfect market
Lindiwe Reply
In economics, a perfect market refers to a theoretical construct where all participants have perfect information, goods are homogenous, there are no barriers to entry or exit, and prices are determined solely by supply and demand. It's an idealized model used for analysis,
Ezea
What is ceteris paribus?
Shukri Reply
other things being equal
AI-Robot
When MP₁ becomes negative, TP start to decline. Extuples Suppose that the short-run production function of certain cut-flower firm is given by: Q=4KL-0.6K2 - 0.112 • Where is quantity of cut flower produced, I is labour input and K is fixed capital input (K-5). Determine the average product of lab
Kelo
Extuples Suppose that the short-run production function of certain cut-flower firm is given by: Q=4KL-0.6K2 - 0.112 • Where is quantity of cut flower produced, I is labour input and K is fixed capital input (K-5). Determine the average product of labour (APL) and marginal product of labour (MPL)
Kelo
yes,thank you
Shukri
Can I ask you other question?
Shukri
what is monopoly mean?
Habtamu Reply
What is different between quantity demand and demand?
Shukri Reply
Quantity demanded refers to the specific amount of a good or service that consumers are willing and able to purchase at a give price and within a specific time period. Demand, on the other hand, is a broader concept that encompasses the entire relationship between price and quantity demanded
Ezea
ok
Shukri
how do you save a country economic situation when it's falling apart
Lilia Reply
what is the difference between economic growth and development
Fiker Reply
Economic growth as an increase in the production and consumption of goods and services within an economy.but Economic development as a broader concept that encompasses not only economic growth but also social & human well being.
Shukri
production function means
Jabir
What do you think is more important to focus on when considering inequality ?
Abdisa Reply
any question about economics?
Awais Reply
sir...I just want to ask one question... Define the term contract curve? if you are free please help me to find this answer 🙏
Asui
it is a curve that we get after connecting the pareto optimal combinations of two consumers after their mutually beneficial trade offs
Awais
thank you so much 👍 sir
Asui
In economics, the contract curve refers to the set of points in an Edgeworth box diagram where both parties involved in a trade cannot be made better off without making one of them worse off. It represents the Pareto efficient allocations of goods between two individuals or entities, where neither p
Cornelius
In economics, the contract curve refers to the set of points in an Edgeworth box diagram where both parties involved in a trade cannot be made better off without making one of them worse off. It represents the Pareto efficient allocations of goods between two individuals or entities,
Cornelius
Suppose a consumer consuming two commodities X and Y has The following utility function u=X0.4 Y0.6. If the price of the X and Y are 2 and 3 respectively and income Constraint is birr 50. A,Calculate quantities of x and y which maximize utility. B,Calculate value of Lagrange multiplier. C,Calculate quantities of X and Y consumed with a given price. D,alculate optimum level of output .
Feyisa Reply
Answer
Feyisa
c
Jabir
the market for lemon has 10 potential consumers, each having an individual demand curve p=101-10Qi, where p is price in dollar's per cup and Qi is the number of cups demanded per week by the i th consumer.Find the market demand curve using algebra. Draw an individual demand curve and the market dema
Gsbwnw Reply
suppose the production function is given by ( L, K)=L¼K¾.assuming capital is fixed find APL and MPL. consider the following short run production function:Q=6L²-0.4L³ a) find the value of L that maximizes output b)find the value of L that maximizes marginal product
Abdureman
types of unemployment
Yomi Reply
What is the difference between perfect competition and monopolistic competition?
Mohammed
Got questions? Join the online conversation and get instant answers!
Jobilize.com Reply
Practice Key Terms 5

Get Jobilize Job Search Mobile App in your pocket Now!

Get it on Google Play Download on the App Store Now


Source:  OpenStax, Chemistry. OpenStax CNX. May 20, 2015 Download for free at http://legacy.cnx.org/content/col11760/1.9
Google Play and the Google Play logo are trademarks of Google Inc.

Notification Switch

Would you like to follow the 'Chemistry' conversation and receive update notifications?

Ask