

| << Chapter < Page | Chapter >> Page > |
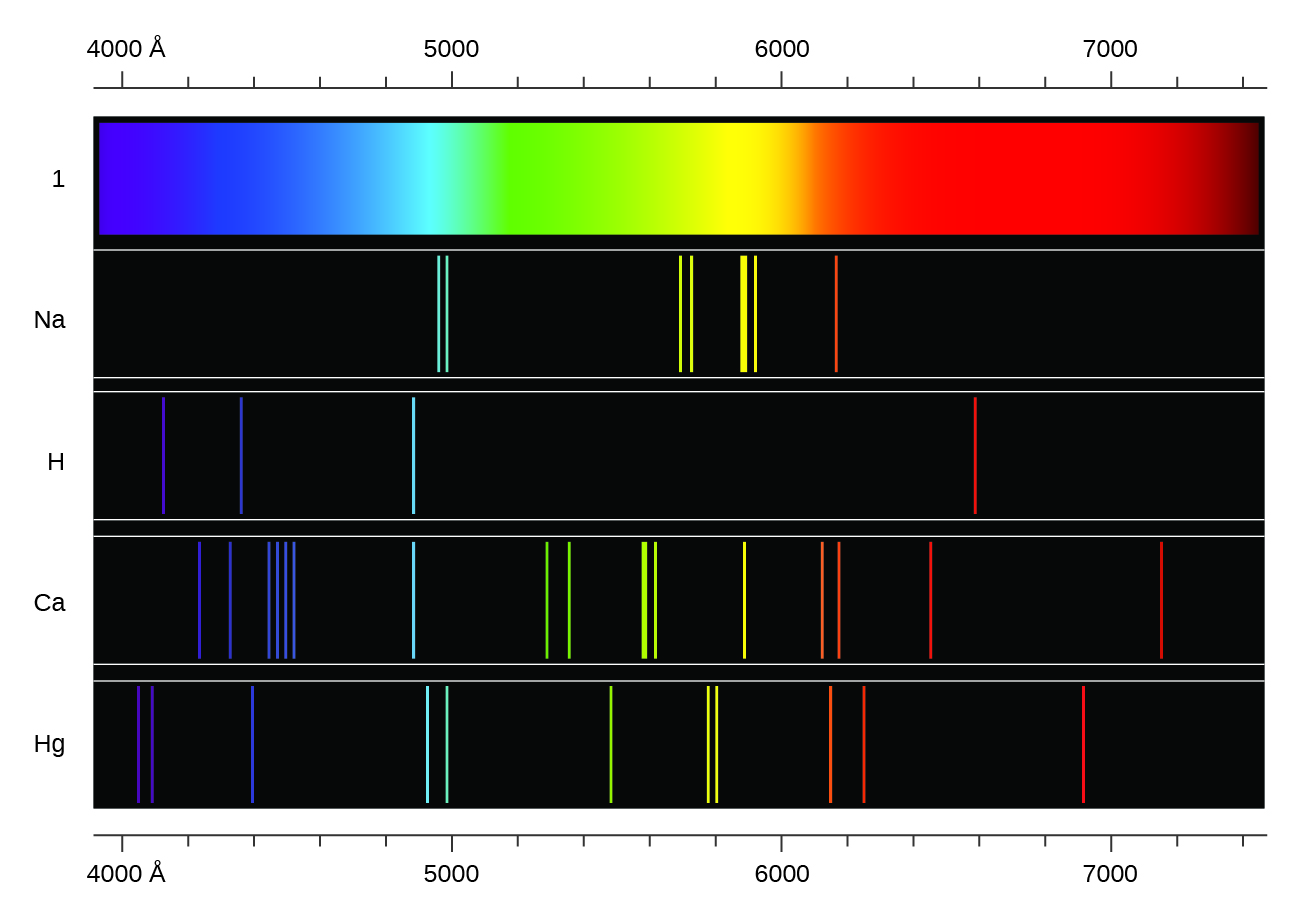
In contrast to continuous spectra, light can also occur as discrete or line spectra having very narrow line widths interspersed throughout the spectral regions such as those shown in [link] . Exciting a gas at low partial pressure using an electrical current, or heating it, will produce line spectra. Fluorescent light bulbs and neon signs operate in this way ( [link] ). Each element displays its own characteristic set of lines, as do molecules, although their spectra are generally much more complicated.

Each emission line consists of a single wavelength of light, which implies that the light emitted by a gas consists of a set of discrete energies. For example, when an electric discharge passes through a tube containing hydrogen gas at low pressure, the H 2 molecules are broken apart into separate H atoms and we see a blue-pink color. Passing the light through a prism produces a line spectrum, indicating that this light is composed of photons of four visible wavelengths, as shown in [link] .
The origin of discrete spectra in atoms and molecules was extremely puzzling to scientists in the late nineteenth century, since according to classical electromagnetic theory, only continuous spectra should be observed. Even more puzzling, in 1885, Johann Balmer was able to derive an empirical equation that related the four visible wavelengths of light emitted by hydrogen atoms to whole integers. That equation is the following one, in which k is a constant:
Other discrete lines for the hydrogen atom were found in the UV and IR regions. Johannes Rydberg generalized Balmer's work and developed an empirical formula that predicted all of hydrogen's emission lines, not just those restricted to the visible range, where, n 1 and n 2 are integers, n 1 < n 2 , and is the Rydberg constant (1.097 10 7 m −1 ).
Even in the late nineteenth century, spectroscopy was a very precise science, and so the wavelengths of hydrogen were measured to very high accuracy, which implied that the Rydberg constant could be determined very precisely as well. That such a simple formula as the Rydberg formula could account for such precise measurements seemed astounding at the time, but it was the eventual explanation for emission spectra by Neils Bohr in 1913 that ultimately convinced scientists to abandon classical physics and spurred the development of modern quantum mechanics.
Light and other forms of electromagnetic radiation move through a vacuum with a constant speed, c , of 2.998 10 8 m s −1 . This radiation shows wavelike behavior, which can be characterized by a frequency, ν , and a wavelength, λ , such that c = λν . Light is an example of a travelling wave. Other important wave phenomena include standing waves, periodic oscillations, and vibrations. Standing waves exhibit quantization, since their wavelengths are limited to discrete integer multiples of some characteristic lengths. Electromagnetic radiation that passes through two closely spaced narrow slits having dimensions roughly similar to the wavelength will show an interference pattern that is a result of constructive and destructive interference of the waves. Electromagnetic radiation also demonstrates properties of particles called photons. The energy of a photon is related to the frequency (or alternatively, the wavelength) of the radiation as E = hν (or ), where h is Planck's constant. That light demonstrates both wavelike and particle-like behavior is known as wave-particle duality. All forms of electromagnetic radiation share these properties, although various forms including X-rays, visible light, microwaves, and radio waves interact differently with matter and have very different practical applications. Electromagnetic radiation can be generated by exciting matter to higher energies, such as by heating it. The emitted light can be either continuous (incandescent sources like the sun) or discrete (from specific types of excited atoms). Continuous spectra often have distributions that can be approximated as blackbody radiation at some appropriate temperature. The line spectrum of hydrogen can be obtained by passing the light from an electrified tube of hydrogen gas through a prism. This line spectrum was simple enough that an empirical formula called the Rydberg formula could be derived from the spectrum. Three historically important paradoxes from the late 19th and early 20th centuries that could not be explained within the existing framework of classical mechanics and classical electromagnetism were the blackbody problem, the photoelectric effect, and the discrete spectra of atoms. The resolution of these paradoxes ultimately led to quantum theories that superseded the classical theories.
Notification Switch
Would you like to follow the 'Chemistry' conversation and receive update notifications?

|
|
|
|
|

|
|

|
|

|
|

|
|

|
|

|
|

|
|

|
|

|
|

|