

| << Chapter < Page | Chapter >> Page > |
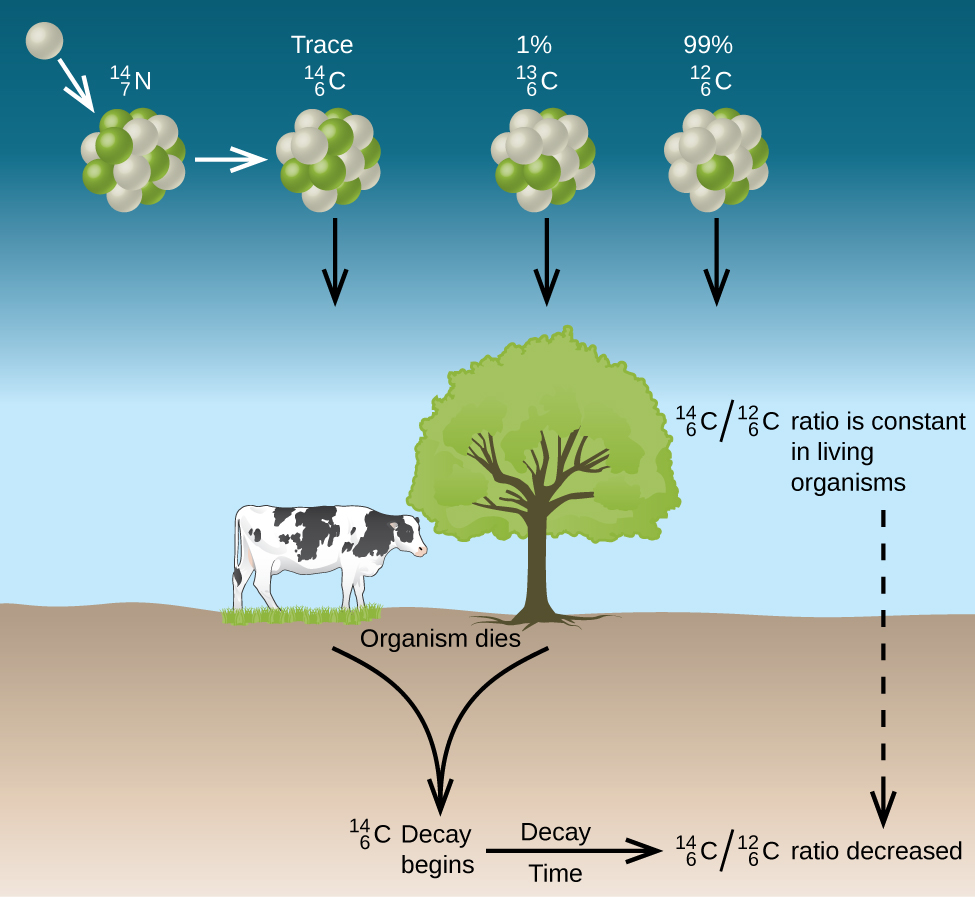
Thus, the ratio gradually decreases after the plant dies. The decrease in the ratio with time provides a measure of the time that has elapsed since the death of the plant (or other organism that ate the plant). [link] visually depicts this process.
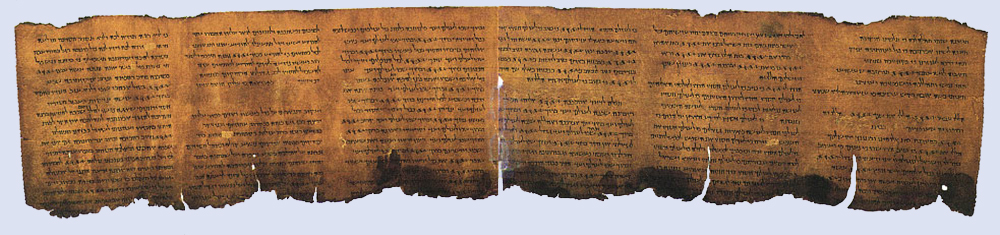
For example, with the half-life of being 5730 years, if the ratio in a wooden object found in an archaeological dig is half what it is in a living tree, this indicates that the wooden object is 5730 years old. Highly accurate determinations of ratios can be obtained from very small samples (as little as a milligram) by the use of a mass spectrometer.
Visit this website to perform simulations of radiometric dating.
where the subscript 0 represents the time when the plants were cut to make the paper, and the subscript t represents the current time.
The decay constant can be determined from the half-life of C-14, 5730 years:
Substituting and solving, we have:
Therefore, the Dead Sea Scrolls are approximately 1900 years old ( [link] ).
about 3350 years ago, or approximately 1340 BC
There have been some significant, well-documented changes to the ratio. The accuracy of a straightforward application of this technique depends on the ratio in a living plant being the same now as it was in an earlier era, but this is not always valid. Due to the increasing accumulation of CO 2 molecules (largely in the atmosphere caused by combustion of fossil fuels (in which essentially all of the has decayed), the ratio of in the atmosphere may be changing. This manmade increase in in the atmosphere causes the ratio to decrease, and this in turn affects the ratio in currently living organisms on the earth. Fortunately, however, we can use other data, such as tree dating via examination of annual growth rings, to calculate correction factors. With these correction factors, accurate dates can be determined. In general, radioactive dating only works for about 10 half-lives; therefore, the limit for carbon-14 dating is about 57,000 years.
Notification Switch
Would you like to follow the 'Chemistry' conversation and receive update notifications?

|
|
|
|
|

|
|

|
|

|
|

|
|
|
|
|

|
|

|
|

|
|

|
|
|
|