<< Chapter < Page Chapter >> Page >
Two sets of bar graphs are shown. The left is labeled, “Before reaction,” and the right is labeled, “At equilibrium.” Both graphs have y-axes labeled, “Concentration ( M ),” and three bars on the x-axes labeled, “Mixture 1,” “Mixture 2,” and “Mixture 3.” The y-axis has a scale beginning at 0.00 and ending at 0.10, with measurement increments of 0.02. The bars on the graphs are color coded and a key is provided with a legend. Red is labeled, “C O;” blue is labeled, “H subscript 2 O;” green is labeled, “C O subscript 2,” and yellow is labeled, “H subscript 2.” The graph on the left shows the red bar for mixture one just above 0.02 and the blue bar near 0.05. For mixture two, the green bar is near 0.05, and the yellow bar is near 0.09. For mixture 3, the red bar is near 0.01, the blue bar is slightly above that with green and yellow topping it off at 0.02. On the right graph, the bar for mixture one shows the red bar slightly above 0.01, the blue bar stacked on it rising slightly above 0.02, the green rising near 0.04, and the yellow bar reaching near 0.05. A label above this bar reads, “Q equals 0.640.” The bar for mixture two shows the red bar slightly above 0.02, the blue bar stacked on it rising near 0.05, the green rising near 0.07, and the yellow bar reaching near 0.10. A label above this bar reads “Q equals 0.640.” The bar for mixture three shows the red bar near 0.01, the blue bar stacked on it rising slightly above 0.01, the green rising near 0.02, and the yellow bar reaching 0.02. A label above this bar reads “Q equals 0.640”.
Concentrations of three mixtures are shown before and after reaching equilibrium at 800 °C for the so-called water gas shift reaction: CO ( g ) + H 2 O ( g ) CO 2 ( g ) + H 2 ( g ) .

Predicting the direction of reaction

Given here are the starting concentrations of reactants and products for three experiments involving this reaction:

CO ( g ) + H 2 O ( g ) CO 2 ( g ) + H 2 ( g )
K c = 0.64

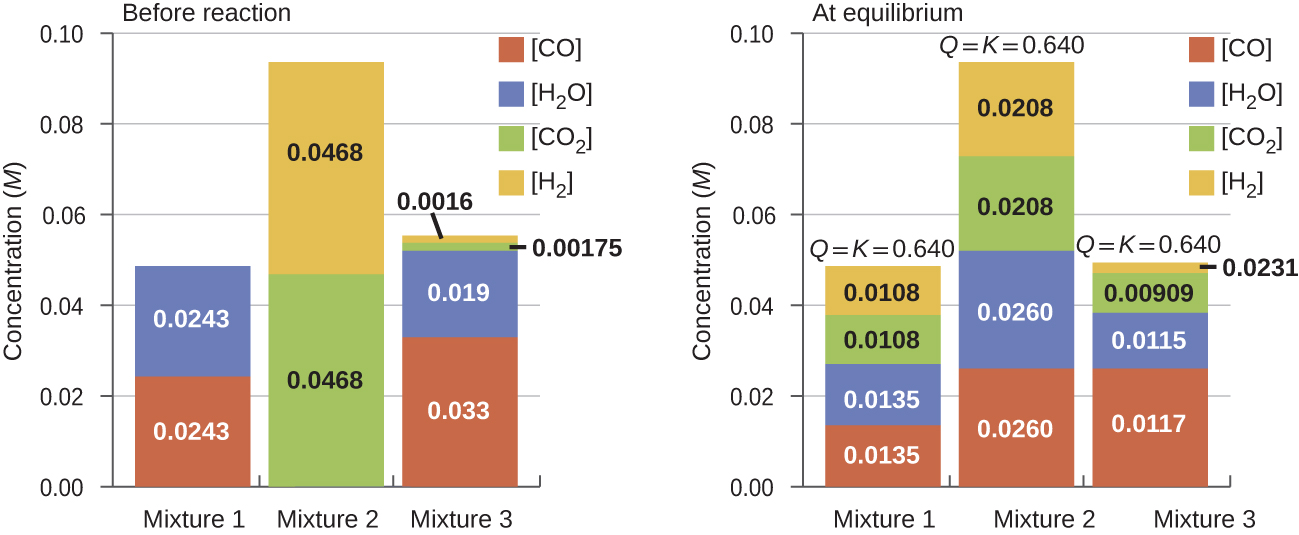
Determine in which direction the reaction proceeds as it goes to equilibrium in each of the three experiments shown.

Reactants/Products Experiment 1 Experiment 2 Experiment 3
[CO] i 0.0203 M 0.011 M 0.0094 M
[H 2 O] i 0.0203 M 0.0011 M 0.0025 M
[CO 2 ] i 0.0040 M 0.037 M 0.0015 M
[H 2 ] i 0.0040 M 0.046 M 0.0076 M

Solution

Experiment 1:

Q c = [ CO 2 ] [ H 2 ] [ CO ] [ H 2 O ] = ( 0.0040 ) ( 0.0040 ) ( 0.0203 ) ( 0.0203 ) = 0.039 .

Q c < K c (0.039<0.64)

The reaction will shift to the right.

Experiment 2:

Q c = [ CO 2 ] [ H 2 ] [ CO ] [ H 2 O ] = ( 0.037 ) ( 0.046 ) ( 0.011 ) ( 0.0011 ) = 1.4 × 10 2

Q c > K c (140>0.64)

The reaction will shift to the left.

Experiment 3:

Q c = [ CO 2 ] [ H 2 ] [ CO ] [ H 2 O ] = ( 0.0015 ) ( 0.0076 ) ( 0.0094 ) ( 0.0025 ) = 0.48

Q c < K c (0.48<0.64)

The reaction will shift to the right.

Check your learning

Calculate the reaction quotient and determine the direction in which each of the following reactions will proceed to reach equilibrium.

(a) A 1.00-L flask containing 0.0500 mol of NO(g), 0.0155 mol of Cl2(g), and 0.500 mol of NOCl:

2 NO ( g ) + Cl 2 ( g ) 2 NOCl ( g ) K c = 4.6 × 10 4

(b) A 5.0-L flask containing 17 g of NH 3 , 14 g of N 2 , and 12 g of H 2 :

N 2 ( g ) + 3 H 2 ( g ) 2 NH 3 ( g ) K c = 0.060

(c) A 2.00-L flask containing 230 g of SO 3 (g):

2 SO 3 ( g ) 2 SO 2 ( g ) + O 2 ( g ) K c = 0.230

Answer:

(a) Q c = 6.45 × 10 3 , shifts right. (b) Q c = 0.12, shifts left. (c) Q c = 0, shifts right

Got questions? Get instant answers now!

In [link] , it was mentioned that the common practice is to omit units when evaluating reaction quotients and equilibrium constants. It should be pointed out that using concentrations in these computations is a convenient but simplified approach that sometimes leads to results that seemingly conflict with the law of mass action. For example, equilibria involving aqueous ions often exhibit equilibrium constants that vary quite significantly (are not constant) at high solution concentrations. This may be avoided by computing K c values using the activities of the reactants and products in the equilibrium system instead of their concentrations. The activity of a substance is a measure of its effective concentration under specified conditions. While a detailed discussion of this important quantity is beyond the scope of an introductory text, it is necessary to be aware of a few important aspects:

  • Activities are dimensionless (unitless) quantities and are in essence “adjusted” concentrations.
  • For relatively dilute solutions, a substance's activity and its molar concentration are roughly equal.
  • Activities for pure condensed phases (solids and liquids) are equal to 1.

As a consequence of this last consideration, Q c and K c expressions do not contain terms for solids or liquids (being numerically equal to 1, these terms have no effect on the expression's value) . Several examples of equilibria yielding such expressions will be encountered in this section.

Practice Key Terms 7

Get Jobilize Job Search Mobile App in your pocket Now!

Get it on Google Play Download on the App Store Now


Source:  OpenStax, Chemistry. OpenStax CNX. May 20, 2015 Download for free at http://legacy.cnx.org/content/col11760/1.9
Google Play and the Google Play logo are trademarks of Google Inc.

Notification Switch

Would you like to follow the 'Chemistry' conversation and receive update notifications?

Ask