<< Chapter < Page Chapter >> Page >
By the end of this section, you will be able to:
  • Explain the function of a catalyst in terms of reaction mechanisms and potential energy diagrams
  • List examples of catalysis in natural and industrial processes

We have seen that the rate of many reactions can be accelerated by catalysts. A catalyst speeds up the rate of a reaction by lowering the activation energy; in addition, the catalyst is regenerated in the process. Several reactions that are thermodynamically favorable in the absence of a catalyst only occur at a reasonable rate when a catalyst is present. One such reaction is catalytic hydrogenation, the process by which hydrogen is added across an alkene C=C bond to afford the saturated alkane product. A comparison of the reaction coordinate diagrams (also known as energy diagrams) for catalyzed and uncatalyzed alkene hydrogenation is shown in [link] .

A graph is shown with the label, “Reaction coordinate,” on the x-axis and the label,“Energy,” on the y-axis. Approximately half-way up the y-axis, a short portion of a black concave down curve which has a horizontal line extended from it across the graph. The left end of this line is labeled “H subscript 2 C equals C H subscript 2 plus H subscript 2.” The black concave down curve extends upward to reach a maximum near the height of the y-axis. The peak of this curve is labeled, “Transition state.” A double sided arrow extends from the horizontal line to the peak of the curve. This arrow is labeled, “Activation energy of Uncatalyzed reation.” From the peak, the curve continues downward to a second horizontally flattened region well below the origin of the curve near the x-axis. This flattened region is shaded in blue and is labeled “H subscript 3 C dash C H subscript 3.” A double sided arrow is drawn from the lowers part of this curve at the far right of the graph to the line extending across the graph above it. This arrow is labeled, “capital delta H less than 0 : exothermic.” A second curve is drawn with the same flattened regions at the start and end of the curve. The height of this curve is about two-thirds the height of the first curve. A double sided arrow is drawn from the horizontal line that originates at the left side of the graph to the peak of this second curve. This arrow is labeled, “Activation energy of catalyzed reaction.”
This graph compares the reaction coordinates for catalyzed and uncatalyzed alkene hydrogenation.

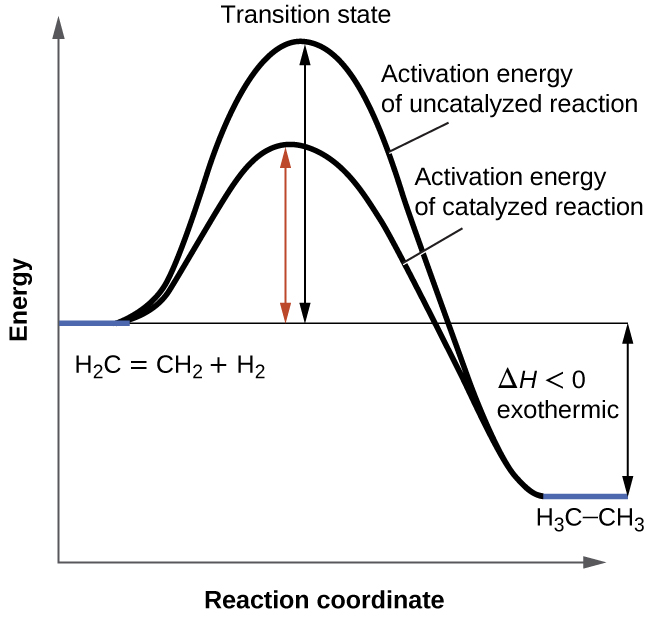
Catalysts function by providing an alternate reaction mechanism that has a lower activation energy than would be found in the absence of the catalyst. In some cases, the catalyzed mechanism may include additional steps, as depicted in the reaction diagrams shown in [link] . This lower activation energy results in an increase in rate as described by the Arrhenius equation. Note that a catalyst decreases the activation energy for both the forward and the reverse reactions and hence accelerates both the forward and the reverse reactions . Consequently, the presence of a catalyst will permit a system to reach equilibrium more quickly, but it has no effect on the position of the equilibrium as reflected in the value of its equilibrium constant (see the later chapter on chemical equilibrium).

A graph is shown with the label, “Extent of reaction,” appearing in a right pointing arrow below the x-axis and the label, “Energy,” in an upward pointing arrow just left of the y-axis. Approximately one-fifth of the way up the y-axis, a very short, somewhat flattened portion of both a red and a blue curve are shown. This region is labeled “Reactants.” A red concave down curve extends upward to reach a maximum near the height of the y-axis. This curve is labeled, “Uncatalyzed pathway.” From the peak, the curve continues downward to a second horizontally flattened region at a height of about one-third the height of the y-axis. This flattened region is labeled, “Products.” A second curve is drawn in blue with the same flattened regions at the start and end of the curve. The height of this curve is about two-thirds the height of the first curve and just right of its maximum, the curve dips low, then rises back and continues a downward trend at a lower height, but similar to that of the red curve. This blue curve is labeled, “Catalyzed pathway.”
This potential energy diagram shows the effect of a catalyst on the activation energy. The catalyst provides a different reaction path with a lower activation energy. As shown, the catalyzed pathway involves a two-step mechanism (note the presence of two transition states) and an intermediate species (represented by the valley between the two transitions states).

Using reaction diagrams to compare catalyzed reactions

The two reaction diagrams here represent the same reaction: one without a catalyst and one with a catalyst. Identify which diagram suggests the presence of a catalyst, and determine the activation energy for the catalyzed reaction:

In this figure, two graphs are shown. The x-axes are labeled, “Extent of reaction,” and the y-axes are labeled, “Energy ( k J ).” The y-axes are marked off from 0 to 50 in intervals of five. In a, a blue curve is shown. It begins with a horizontal segment at about 6. The curve then rises sharply near the middle to reach a maximum of about 32 and similarly falls to another horizontal segment at about 10. In b, the curve begins and ends similarly, but the maximum reached near the center of the graph is only 20.

Solution

A catalyst does not affect the energy of reactant or product, so those aspects of the diagrams can be ignored; they are, as we would expect, identical in that respect. There is, however, a noticeable difference in the transition state, which is distinctly lower in diagram (b) than it is in (a). This indicates the use of a catalyst in diagram (b). The activation energy is the difference between the energy of the starting reagents and the transition state—a maximum on the reaction coordinate diagram. The reagents are at 6 kJ and the transition state is at 20 kJ, so the activation energy can be calculated as follows:

E a = 20 kJ 6 kJ = 14 kJ

Check your learning

Determine which of the two diagrams here (both for the same reaction) involves a catalyst, and identify the activation energy for the catalyzed reaction:

In this figure, two graphs are shown. The x-axes are labeled, “Extent of reaction,” and the y-axes are labeledc “Energy (k J).” The y-axes are marked off from 0 to 100 at intervals of 10. In a, a blue curve is shown. It begins with a horizontal segment at about 10. The curve then rises sharply near the middle to reach a maximum of about 91, then sharply falls to about 52, again rises sharply to about 73 and falls to another horizontal segment at about 5. In b, the curve begins and ends similarly, but the first peak reaches about 81, drops to about 55, then rises to about 77 before falling to the horizontal region at about 5.

Answer:

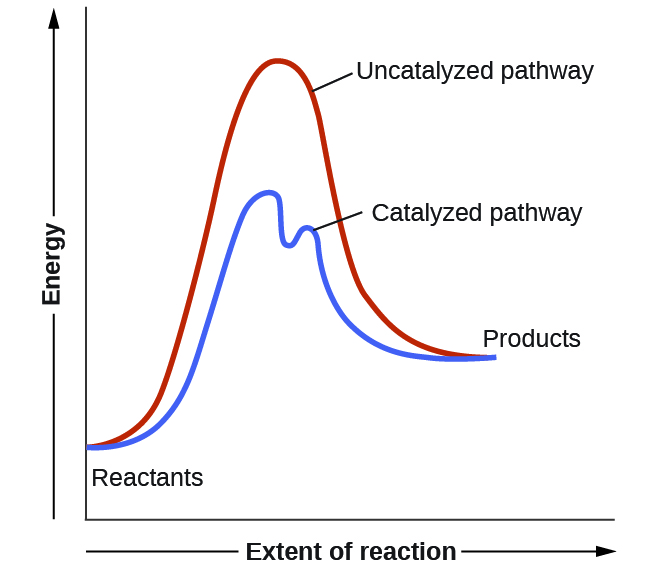
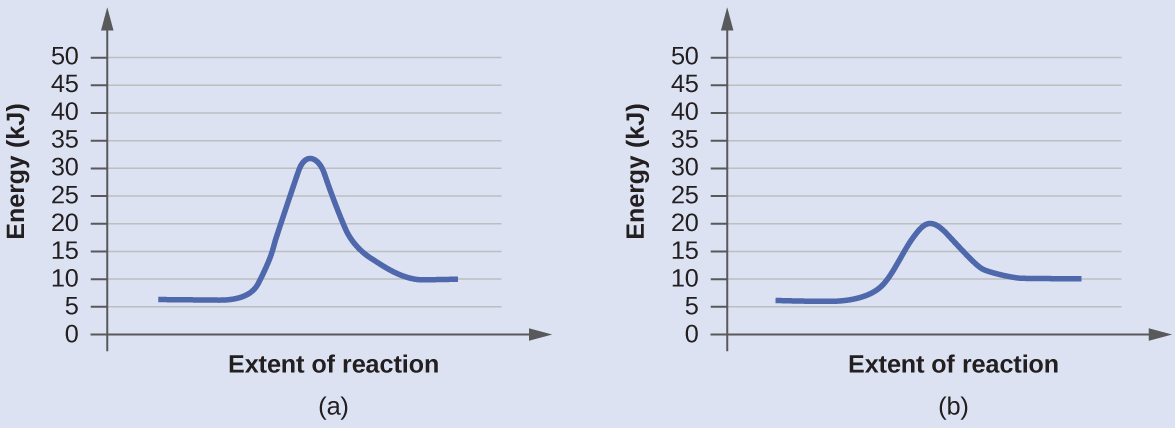
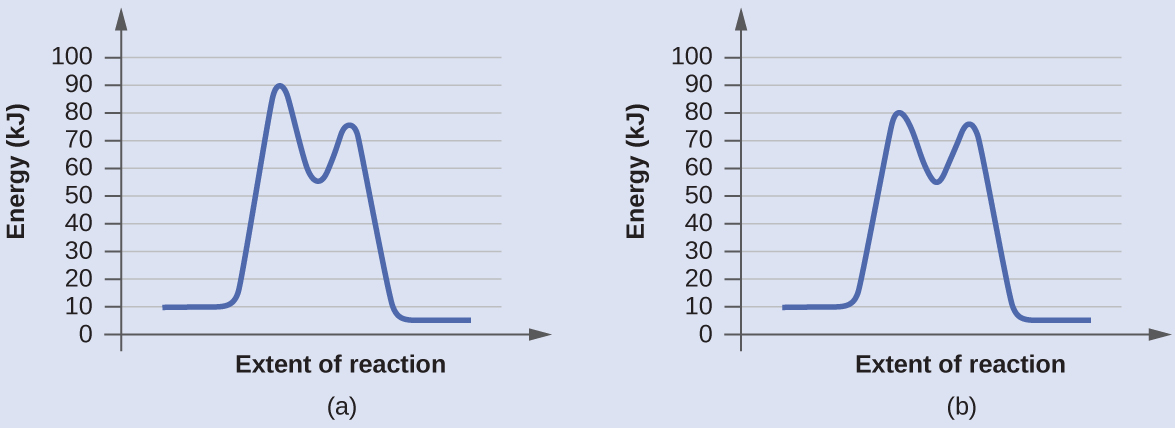
Diagram (b) is a catalyzed reaction with an activation energy of about 70 kJ.

Got questions? Get instant answers now!

Questions & Answers

how do you get the 2/50
Abba Reply
number of sport play by 50 student construct discrete data
Aminu Reply
width of the frangebany leaves on how to write a introduction
Theresa Reply
Solve the mean of variance
Veronica Reply
Step 1: Find the mean. To find the mean, add up all the scores, then divide them by the number of scores. ... Step 2: Find each score's deviation from the mean. ... Step 3: Square each deviation from the mean. ... Step 4: Find the sum of squares. ... Step 5: Divide the sum of squares by n – 1 or N.
kenneth
what is error
Yakuba Reply
Is mistake done to something
Vutshila
Hy
anas
hy
What is the life teble
anas
hy
Jibrin
statistics is the analyzing of data
Tajudeen Reply
what is statics?
Zelalem Reply
how do you calculate mean
Gloria Reply
diveving the sum if all values
Shaynaynay
let A1,A2 and A3 events be independent,show that (A1)^c, (A2)^c and (A3)^c are independent?
Fisaye Reply
what is statistics
Akhisani Reply
data collected all over the world
Shaynaynay
construct a less than and more than table
Imad Reply
The sample of 16 students is taken. The average age in the sample was 22 years with astandard deviation of 6 years. Construct a 95% confidence interval for the age of the population.
Aschalew Reply
Bhartdarshan' is an internet-based travel agency wherein customer can see videos of the cities they plant to visit. The number of hits daily is a normally distributed random variable with a mean of 10,000 and a standard deviation of 2,400 a. what is the probability of getting more than 12,000 hits? b. what is the probability of getting fewer than 9,000 hits?
Akshay Reply
Bhartdarshan'is an internet-based travel agency wherein customer can see videos of the cities they plan to visit. The number of hits daily is a normally distributed random variable with a mean of 10,000 and a standard deviation of 2,400. a. What is the probability of getting more than 12,000 hits
Akshay
1
Bright
Sorry i want to learn more about this question
Bright
Someone help
Bright
a= 0.20233 b=0.3384
Sufiyan
a
Shaynaynay
How do I interpret level of significance?
Mohd Reply
It depends on your business problem or in Machine Learning you could use ROC- AUC cruve to decide the threshold value
Shivam
how skewness and kurtosis are used in statistics
Owen Reply
yes what is it
Taneeya
Got questions? Join the online conversation and get instant answers!
Jobilize.com Reply
Practice Key Terms 2

Get Jobilize Job Search Mobile App in your pocket Now!

Get it on Google Play Download on the App Store Now


Source:  OpenStax, Chemistry. OpenStax CNX. May 20, 2015 Download for free at http://legacy.cnx.org/content/col11760/1.9
Google Play and the Google Play logo are trademarks of Google Inc.

Notification Switch

Would you like to follow the 'Chemistry' conversation and receive update notifications?

Ask