<< Chapter < Page Chapter >> Page >
C + D A + B
A graph is shown with the label, “Extent of reaction,” bon the x-axis and the label, “Potential energy,” on the y-axis. Above the x-axis, a portion of a dashed curve is labeled “A plus B.” From the right end of this region, the concave down curve continues upward to reach a maximum near the height of the y-axis. The peak of this curve is labeled, “Transition state.” A double sided arrow extends from a dashed horizontal line that originates at the y-axis at a common endpoint with the curve to the peak of the curve. This arrow is labeled “E subscript a.” A second horizontal dashed line segment is drawn from the right end of the black curve left to the vertical axis at a level significantly lower than the initial “A plus B” labeled end of the curve. The end of the curve that is shared with this segment is labeled, “C plus D.” The curve, which was initially dashed, continues as a solid curve from the maximum to its endpoint at the right side of the diagram. A second double sided arrow is shown. This arrow extends between the two dashed horizontal lines and is labeled, “capital delta H.”
This graph shows the potential energy relationships for the reaction A + B C + D . The dashed portion of the curve represents the energy of the system with a molecule of A and a molecule of B present, and the solid portion the energy of the system with a molecule of C and a molecule of D present. The activation energy for the forward reaction is represented by E a . The activation energy for the reverse reaction is greater than that for the forward reaction by an amount equal to Δ H. The curve’s peak is represented the transition state.

We can use the Arrhenius equation    to relate the activation energy and the rate constant, k , of a given reaction:

k = A e E a / R T

In this equation, R is the ideal gas constant, which has a value 8.314 J/mol/K, T is temperature on the Kelvin scale, E a is the activation energy in joules per mole, e is the constant 2.7183, and A is a constant called the frequency factor , which is related to the frequency of collisions and the orientation of the reacting molecules.

Both postulates of the collision theory of reaction rates are accommodated in the Arrhenius equation. The frequency factor A is related to the rate at which collisions having the correct orientation occur. The exponential term, e E a / R T , is related to the fraction of collisions providing adequate energy to overcome the activation barrier of the reaction.

At one extreme, the system does not contain enough energy for collisions to overcome the activation barrier. In such cases, no reaction occurs. At the other extreme, the system has so much energy that every collision with the correct orientation can overcome the activation barrier, causing the reaction to proceed. In such cases, the reaction is nearly instantaneous.

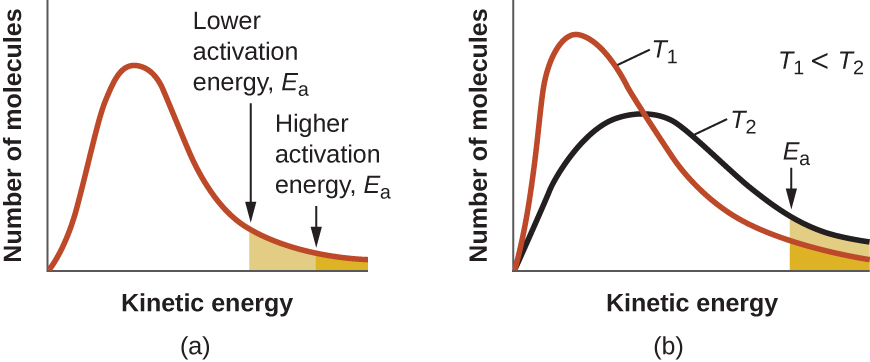
The Arrhenius equation describes quantitatively much of what we have already discussed about reaction rates. For two reactions at the same temperature, the reaction with the higher activation energy has the lower rate constant and the slower rate. The larger value of E a results in a smaller value for e E a / R T , reflecting the smaller fraction of molecules with enough energy to react. Alternatively, the reaction with the smaller E a has a larger fraction of molecules with enough energy to react. This will be reflected as a larger value of e E a / R T , a larger rate constant, and a faster rate for the reaction. An increase in temperature has the same effect as a decrease in activation energy. A larger fraction of molecules has the necessary energy to react ( [link] ), as indicated by an increase in the value of e E a / R T . The rate constant is also directly proportional to the frequency factor, A . Hence a change in conditions or reactants that increases the number of collisions with a favorable orientation for reaction results in an increase in A and, consequently, an increase in k .

Two graphs are shown each with an x-axis label of “Kinetic energy” and a y-axis label of “Fraction of molecules.” Each contains a positively skewed curve indicated in red that begins at the origin and approaches the x-axis at the right side of the graph. In a, a small area under the far right end of the curve is shaded orange. An arrow points down from above the curve to the left end of this region where the shading begins. This arrow is labeled, “Higher activation energy, E subscript a.” In b, the same red curve appears, and a second curve is drawn in black. It is also positively skewed, but reaches a lower maximum value and takes on a broadened appearance as compared to the curve in red. In this graph, the red curve is labeled, “T subscript 1” and the black curve is labeled, “T subscript 2.” In the open space at the upper right on the graph is the label, “T subscript 1 less than T subscript 2.” As with the first graph, the region under the curves at the far right is shaded orange and a downward arrow labeled “E subscript a” points to the left end of this shaded region.
(a) As the activation energy of a reaction decreases, the number of molecules with at least this much energy increases, as shown by the shaded areas. (b) At a higher temperature, T 2 , more molecules have kinetic energies greater than E a , as shown by the yellow shaded area.
Practice Key Terms 5

Get Jobilize Job Search Mobile App in your pocket Now!

Get it on Google Play Download on the App Store Now


Source:  OpenStax, Chemistry. OpenStax CNX. May 20, 2015 Download for free at http://legacy.cnx.org/content/col11760/1.9
Google Play and the Google Play logo are trademarks of Google Inc.

Notification Switch

Would you like to follow the 'Chemistry' conversation and receive update notifications?

Ask