

| << Chapter < Page | Chapter >> Page > |
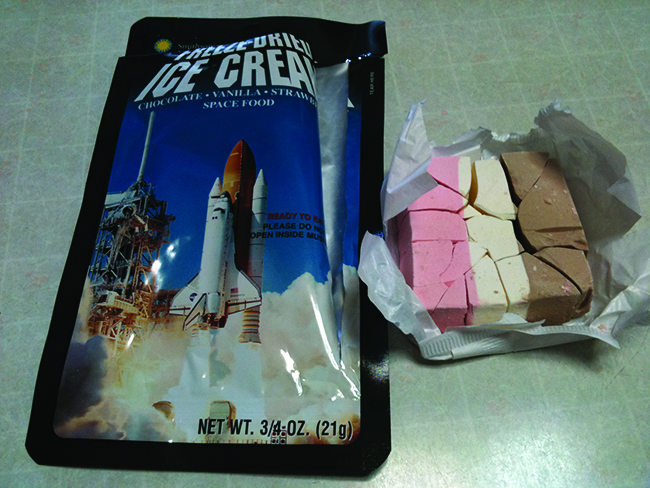
The solid-vapor curve, labeled AB in [link] , indicates the temperatures and pressures at which ice and water vapor are in equilibrium. These temperature-pressure data pairs correspond to the sublimation, or deposition, points for water. If we could zoom in on the solid-gas line in [link] , we would see that ice has a vapor pressure of about 0.20 kPa at −10 °C. Thus, if we place a frozen sample in a vacuum with a pressure less than 0.20 kPa, ice will sublime. This is the basis for the “freeze-drying” process often used to preserve foods, such as the ice cream shown in [link] .
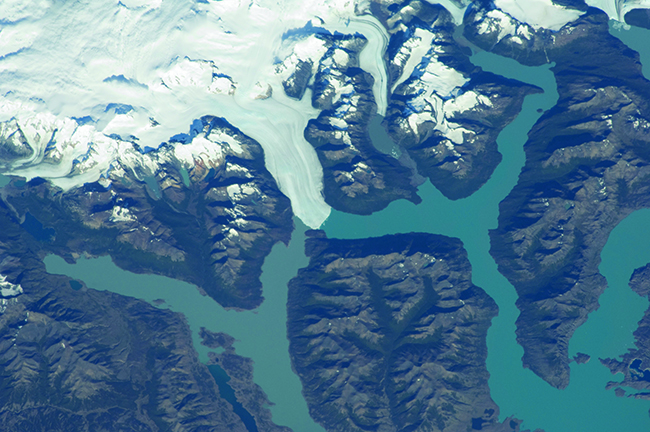
The solid-liquid curve labeled BD shows the temperatures and pressures at which ice and liquid water are in equilibrium, representing the melting/freezing points for water. Note that this curve exhibits a slight negative slope (greatly exaggerated for clarity), indicating that the melting point for water decreases slightly as pressure increases. Water is an unusual substance in this regard, as most substances exhibit an increase in melting point with increasing pressure. This behavior is partly responsible for the movement of glaciers, like the one shown in [link] . The bottom of a glacier experiences an immense pressure due to its weight that can melt some of the ice, forming a layer of liquid water on which the glacier may more easily slide.
The point of intersection of all three curves is labeled B in [link] . At the pressure and temperature represented by this point, all three phases of water coexist in equilibrium. This temperature-pressure data pair is called the triple point . At pressures lower than the triple point, water cannot exist as a liquid, regardless of the temperature.
(a) −10 °C and 50 kPa
(b) 25 °C and 90 kPa
(c) 50 °C and 40 kPa
(d) 80 °C and 5 kPa
(e) −10 °C and 0.3 kPa
(f) 50 °C and 0.3 kPa
At 0.3 kPa: at −58 °C. At 50 kPa: at 0 °C, l ⟶ g at 78 °C
Consider the phase diagram for carbon dioxide shown in [link] as another example. The solid-liquid curve exhibits a positive slope, indicating that the melting point for CO 2 increases with pressure as it does for most substances (water being a notable exception as described previously). Notice that the triple point is well above 1 atm, indicating that carbon dioxide cannot exist as a liquid under ambient pressure conditions. Instead, cooling gaseous carbon dioxide at 1 atm results in its deposition into the solid state. Likewise, solid carbon dioxide does not melt at 1 atm pressure but instead sublimes to yield gaseous CO 2 . Finally, notice that the critical point for carbon dioxide is observed at a relatively modest temperature and pressure in comparison to water.
Notification Switch
Would you like to follow the 'Chemistry' conversation and receive update notifications?

|
|
|
|
|

|
|

|
|

|
|

|
|

|
|

|
|

|
|

|
|

|
|

|