<< Chapter < Page Chapter >> Page >

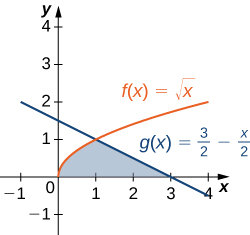
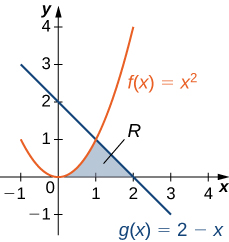
Consider the region depicted in the following figure. Find the area of R .

This figure is has two graphs in the first quadrant. They are the functions f(x) = squareroot of x and g(x)= 3/2 – x/2. In between these graphs is a shaded region, bounded to the left by f(x) and to the right by g(x). All of which is above the x-axis. The shaded area is between x=0 and x=3.

5 3 units 2

Got questions? Get instant answers now!

Regions defined with respect to y

In [link] , we had to evaluate two separate integrals to calculate the area of the region. However, there is another approach that requires only one integral. What if we treat the curves as functions of y , instead of as functions of x ? Review [link] . Note that the left graph, shown in red, is represented by the function y = f ( x ) = x 2 . We could just as easily solve this for x and represent the curve by the function x = v ( y ) = y . (Note that x = y is also a valid representation of the function y = f ( x ) = x 2 as a function of y . However, based on the graph, it is clear we are interested in the positive square root.) Similarly, the right graph is represented by the function y = g ( x ) = 2 x , but could just as easily be represented by the function x = u ( y ) = 2 y . When the graphs are represented as functions of y , we see the region is bounded on the left by the graph of one function and on the right by the graph of the other function. Therefore, if we integrate with respect to y , we need to evaluate one integral only. Let’s develop a formula for this type of integration.

Let u ( y ) and v ( y ) be continuous functions over an interval [ c , d ] such that u ( y ) v ( y ) for all y [ c , d ] . We want to find the area between the graphs of the functions, as shown in the following figure.

This figure is has two graphs in the first quadrant. They are the functions v(y) and u(y). In between these graphs is a shaded region, bounded to the left by v(y) and to the right by u(y). The region is labeled R. The shaded area is between the horizontal boundaries of y=c and y=d.
We can find the area between the graphs of two functions, u ( y ) and v ( y ) .

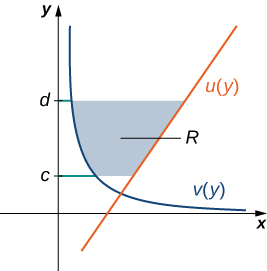
This time, we are going to partition the interval on the y -axis and use horizontal rectangles to approximate the area between the functions. So, for i = 0 , 1 , 2 ,… , n , let Q = { y i } be a regular partition of [ c , d ] . Then, for i = 1 , 2 ,… , n , choose a point y i * [ y i 1 , y i ] , then over each interval [ y i 1 , y i ] construct a rectangle that extends horizontally from v ( y i * ) to u ( y i * ) . [link] (a) shows the rectangles when y i * is selected to be the lower endpoint of the interval and n = 10 . [link] (b) shows a representative rectangle in detail.

This figure is has three graphs. The first figure has two curves. They are the functions v(y*) and u(y*). In between these curves is a horizontal rectangle. The second figure labeled “(a)”, is a shaded region, bounded to the left by v(y) and to the right by u(y). The shaded area is between the horizontal boundaries of y=c and y=d. This shaded area is broken into rectangles between the curves. The third figure, labeled “(b)”, is the two curves v(y*) and u(y*). In between the curves is a horizontal rectangle with width delta y.
(a) Approximating the area between the graphs of two functions, u ( y ) and v ( y ) , with rectangles. (b) The area of a typical rectangle.

The height of each individual rectangle is Δ y and the width of each rectangle is u ( y i * ) v ( y i * ) . Therefore, the area between the curves is approximately

A i = 1 n [ u ( y i * ) v ( y i * ) ] Δ y .

This is a Riemann sum, so we take the limit as n , obtaining

A = lim n i = 1 n [ u ( y i * ) v ( y i * ) ] Δ y = c d [ u ( y ) v ( y ) ] d y .

These findings are summarized in the following theorem.

Finding the area between two curves, integrating along the y -axis

Let u ( y ) and v ( y ) be continuous functions such that u ( y ) v ( y ) for all y [ c , d ] . Let R denote the region bounded on the right by the graph of u ( y ) , on the left by the graph of v ( y ) , and above and below by the lines y = d and y = c , respectively. Then, the area of R is given by

A = c d [ u ( y ) v ( y ) ] d y .

Integrating with respect to y

Let’s revisit [link] , only this time let’s integrate with respect to y . Let R be the region depicted in [link] . Find the area of R by integrating with respect to y .

This figure is has two graphs in the first quadrant. They are the functions f(x) = x^2 and g(x)= 2-x. In between these graphs is a shaded region, bounded to the left by f(x) and to the right by g(x). All of which is above the x-axis. The region is labeled R. The shaded area is between x=0 and x=2.
The area of region R can be calculated using one integral only when the curves are treated as functions of y .

We must first express the graphs as functions of y . As we saw at the beginning of this section, the curve on the left can be represented by the function x = v ( y ) = y , and the curve on the right can be represented by the function x = u ( y ) = 2 y .

Now we have to determine the limits of integration. The region is bounded below by the x -axis, so the lower limit of integration is y = 0 . The upper limit of integration is determined by the point where the two graphs intersect, which is the point ( 1 , 1 ) , so the upper limit of integration is y = 1 . Thus, we have [ c , d ] = [ 0 , 1 ] .

Calculating the area of the region, we get

A = c d [ u ( y ) v ( y ) ] d y = 0 1 [ ( 2 y ) y ] d y = [ 2 y y 2 2 2 3 y 3 / 2 ] | 0 1 = 5 6 .

The area of the region is 5 / 6 units 2 .

Got questions? Get instant answers now!

Questions & Answers

calculate molarity of NaOH solution when 25.0ml of NaOH titrated with 27.2ml of 0.2m H2SO4
Gasin Reply
what's Thermochemistry
rhoda Reply
the study of the heat energy which is associated with chemical reactions
Kaddija
How was CH4 and o2 was able to produce (Co2)and (H2o
Edafe Reply
explain please
Victory
First twenty elements with their valences
Martine Reply
what is chemistry
asue Reply
what is atom
asue
what is the best way to define periodic table for jamb
Damilola Reply
what is the change of matter from one state to another
Elijah Reply
what is isolation of organic compounds
IKyernum Reply
what is atomic radius
ThankGod Reply
Read Chapter 6, section 5
Dr
Read Chapter 6, section 5
Kareem
Atomic radius is the radius of the atom and is also called the orbital radius
Kareem
atomic radius is the distance between the nucleus of an atom and its valence shell
Amos
Read Chapter 6, section 5
paulino
Bohr's model of the theory atom
Ayom Reply
is there a question?
Dr
when a gas is compressed why it becomes hot?
ATOMIC
It has no oxygen then
Goldyei
read the chapter on thermochemistry...the sections on "PV" work and the First Law of Thermodynamics should help..
Dr
Which element react with water
Mukthar Reply
Mgo
Ibeh
an increase in the pressure of a gas results in the decrease of its
Valentina Reply
definition of the periodic table
Cosmos Reply
What is the lkenes
Da Reply
what were atoms composed of?
Moses Reply
Got questions? Join the online conversation and get instant answers!
Jobilize.com Reply

Get Jobilize Job Search Mobile App in your pocket Now!

Get it on Google Play Download on the App Store Now


Source:  OpenStax, Calculus volume 1. OpenStax CNX. Feb 05, 2016 Download for free at http://cnx.org/content/col11964/1.2
Google Play and the Google Play logo are trademarks of Google Inc.

Notification Switch

Would you like to follow the 'Calculus volume 1' conversation and receive update notifications?

Ask