

| << Chapter < Page | Chapter >> Page > |

Just as with algebraic functions, we can apply transformations to trigonometric functions. In particular, consider the following function:
In [link] , the constant causes a horizontal or phase shift. The factor changes the period. This transformed sine function will have a period The factor results in a vertical stretch by a factor of We say is the “amplitude of ” The constant causes a vertical shift.
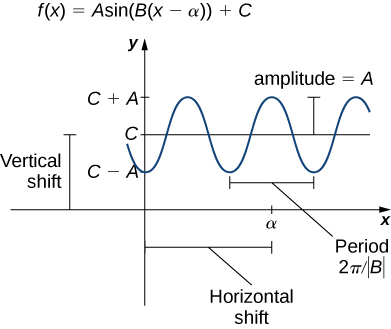
Notice in [link] that the graph of is the graph of shifted to the left units. Therefore, we can write Similarly, we can view the graph of as the graph of shifted right units, and state that
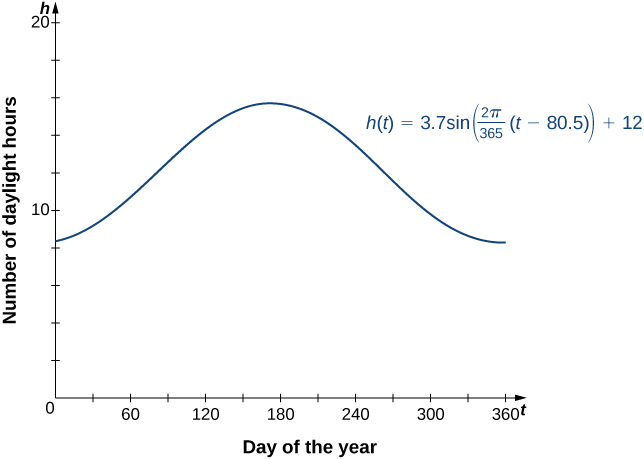
A shifted sine curve arises naturally when graphing the number of hours of daylight in a given location as a function of the day of the year. For example, suppose a city reports that June 21 is the longest day of the year with hours and December 21 is the shortest day of the year with hours. It can be shown that the function
is a model for the number of hours of daylight as a function of day of the year ( [link] ).
Sketch a graph of
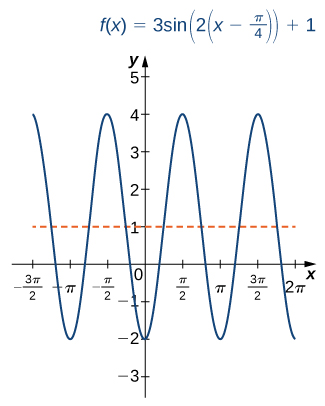
This graph is a phase shift of to the right by units, followed by a horizontal compression by a factor of 2, a vertical stretch by a factor of 3, and then a vertical shift by 1 unit. The period of is
Describe the relationship between the graph of and the graph of
To graph the graph of needs to be compressed horizontally by a factor of 4, then stretched vertically by a factor of 3, then shifted down 5 units. The function will have a period of and an amplitude of 3.
For the following exercises, convert each angle in degrees to radians. Write the answer as a multiple of
For the following exercises, convert each angle in radians to degrees.
Evaluate the following functional values.
For the following exercises, consider triangle ABC , a right triangle with a right angle at C. a. Find the missing side of the triangle. b. Find the six trigonometric function values for the angle at A . Where necessary, round to one decimal place.
Notification Switch
Would you like to follow the 'Calculus volume 1' conversation and receive update notifications?

|
|

|
|

|
|

|
|

|
|

|
|

|
|

|
|
|
|
|

|