| << Chapter < Page | Chapter >> Page > |
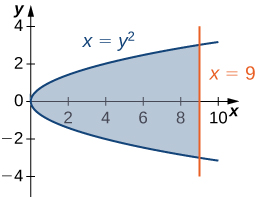
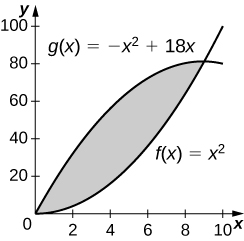
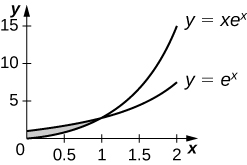
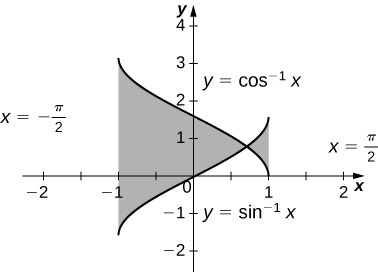
Let’s revisit the checkpoint associated with [link] , only this time, let’s integrate with respect to Let be the region depicted in the following figure. Find the area of by integrating with respect to
units 2
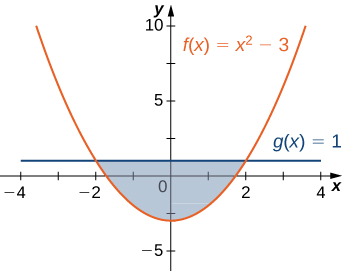
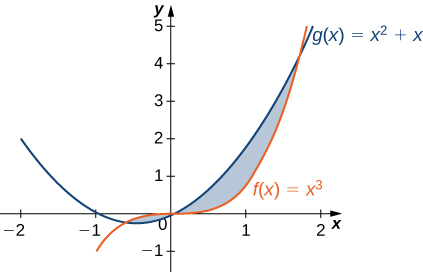
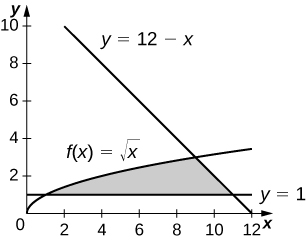
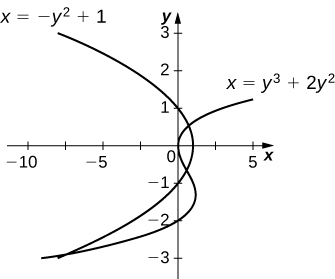
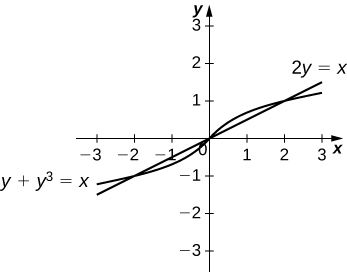
For the following exercises, determine the area of the region between the two curves in the given figure by integrating over the
For the following exercises, split the region between the two curves into two smaller regions, then determine the area by integrating over the Note that you will have two integrals to solve.
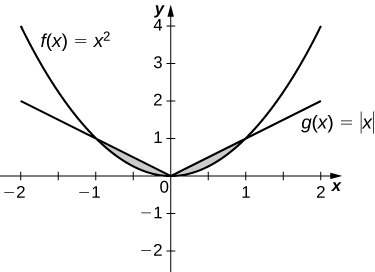
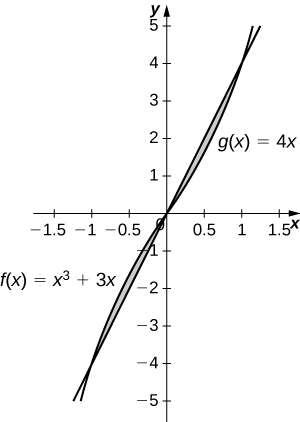
For the following exercises, determine the area of the region between the two curves by integrating over the
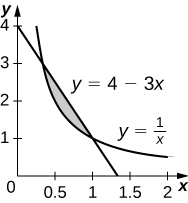
For the following exercises, graph the equations and shade the area of the region between the curves. Determine its area by integrating over the
For the following exercises, graph the equations and shade the area of the region between the curves. If necessary, break the region into sub-regions to determine its entire area.
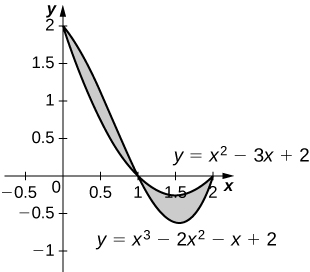
For the following exercises, graph the equations and shade the area of the region between the curves. Determine its area by integrating over the
For the following exercises, graph the equations and shade the area of the region between the curves. Determine its area by integrating over the x -axis or y -axis, whichever seems more convenient.
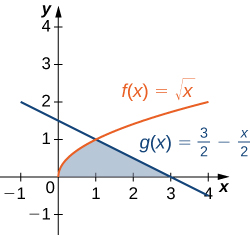
For the following exercises, find the exact area of the region bounded by the given equations if possible. If you are unable to determine the intersection points analytically, use a calculator to approximate the intersection points with three decimal places and determine the approximate area of the region.
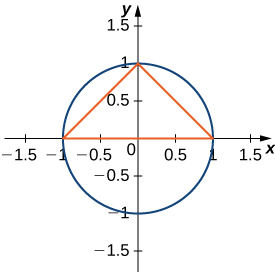
The largest triangle with a base on the that fits inside the upper half of the unit circle is given by and See the following figure. What is the area inside the semicircle but outside the triangle?
A factory selling cell phones has a marginal cost function where represents the number of cell phones, and a marginal revenue function given by Find the area between the graphs of these curves and What does this area represent?
total profit for cell phones sold
An amusement park has a marginal cost function where represents the number of tickets sold, and a marginal revenue function given by Find the total profit generated when selling tickets. Use a calculator to determine intersection points, if necessary, to two decimal places.
The tortoise versus the hare: The speed of the hare is given by the sinusoidal function whereas the speed of the tortoise is where is time measured in hours and the speed is measured in miles per hour. Find the area between the curves from time to the first time after one hour when the tortoise and hare are traveling at the same speed. What does it represent? Use a calculator to determine the intersection points, if necessary, accurate to three decimal places.
mi represents how far ahead the hare is from the tortoise
The tortoise versus the hare: The speed of the hare is given by the sinusoidal function whereas the speed of the tortoise is where is time measured in hours and speed is measured in kilometers per hour. If the race is over in hour, who won the race and by how much? Use a calculator to determine the intersection points, if necessary, accurate to three decimal places.
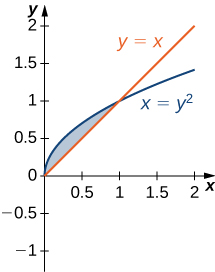
For the following exercises, find the area between the curves by integrating with respect to and then with respect to Is one method easier than the other? Do you obtain the same answer?
For the following exercises, solve using calculus, then check your answer with geometry.
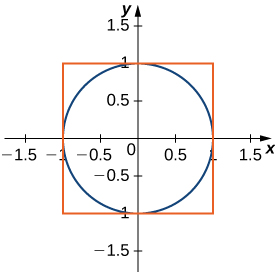
Determine the equations for the sides of the square that touches the unit circle on all four sides, as seen in the following figure. Find the area between the perimeter of this square and the unit circle. Is there another way to solve this without using calculus?
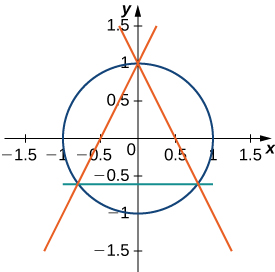
Find the area between the perimeter of the unit circle and the triangle created from and as seen in the following figure. Is there a way to solve this without using calculus?
Notification Switch
Would you like to follow the 'Calculus volume 1' conversation and receive update notifications?

|
|

|
|

|
|

|
|

|
|
|
|
|

|
|
|
|
|

|
|

|