<< Chapter < Page Chapter >> Page >
  • Determine the length of a curve, y = f ( x ) , between two points.
  • Determine the length of a curve, x = g ( y ) , between two points.
  • Find the surface area of a solid of revolution.

In this section, we use definite integrals to find the arc length of a curve. We can think of arc length    as the distance you would travel if you were walking along the path of the curve. Many real-world applications involve arc length. If a rocket is launched along a parabolic path, we might want to know how far the rocket travels. Or, if a curve on a map represents a road, we might want to know how far we have to drive to reach our destination.

We begin by calculating the arc length of curves defined as functions of x , then we examine the same process for curves defined as functions of y . (The process is identical, with the roles of x and y reversed.) The techniques we use to find arc length can be extended to find the surface area of a surface of revolution, and we close the section with an examination of this concept.

Arc length of the curve y = f ( x )

In previous applications of integration, we required the function f ( x ) to be integrable, or at most continuous. However, for calculating arc length we have a more stringent requirement for f ( x ) . Here, we require f ( x ) to be differentiable, and furthermore we require its derivative, f ( x ) , to be continuous. Functions like this, which have continuous derivatives, are called smooth . (This property comes up again in later chapters.)

Let f ( x ) be a smooth function defined over [ a , b ] . We want to calculate the length of the curve from the point ( a , f ( a ) ) to the point ( b , f ( b ) ) . We start by using line segments to approximate the length of the curve. For i = 0 , 1 , 2 ,… , n , let P = { x i } be a regular partition of [ a , b ] . Then, for i = 1 , 2 ,… , n , construct a line segment from the point ( x i 1 , f ( x i 1 ) ) to the point ( x i , f ( x i ) ) . Although it might seem logical to use either horizontal or vertical line segments, we want our line segments to approximate the curve as closely as possible. [link] depicts this construct for n = 5 .

This figure is a graph in the first quadrant. The curve increases and decreases. It is divided into parts at the points a=xsub0, xsub1, xsub2, xsub3, xsub4, and xsub5=b. Also, there are line segments between the points on the curve.
We can approximate the length of a curve by adding line segments.

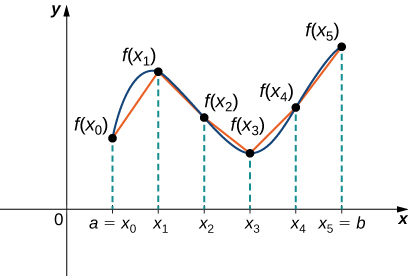
To help us find the length of each line segment, we look at the change in vertical distance as well as the change in horizontal distance over each interval. Because we have used a regular partition, the change in horizontal distance over each interval is given by Δ x . The change in vertical distance varies from interval to interval, though, so we use Δ y i = f ( x i ) f ( x i 1 ) to represent the change in vertical distance over the interval [ x i 1 , x i ] , as shown in [link] . Note that some (or all) Δ y i may be negative.

This figure is a graph. It is a curve above the x-axis beginning at the point f(xsubi-1). The curve ends in the first quadrant at the point f(xsubi). Between the two points on the curve is a line segment. A right triangle is formed with this line segment as the hypotenuse, a horizontal segment with length delta x, and a vertical line segment with length delta y.
A representative line segment approximates the curve over the interval [ x i 1 , x i ] .

By the Pythagorean theorem, the length of the line segment is ( Δ x ) 2 + ( Δ y i ) 2 . We can also write this as Δ x 1 + ( ( Δ y i ) / ( Δ x ) ) 2 . Now, by the Mean Value Theorem, there is a point x i * [ x i 1 , x i ] such that f ( x i * ) = ( Δ y i ) / ( Δ x ) . Then the length of the line segment is given by Δ x 1 + [ f ( x i * ) ] 2 . Adding up the lengths of all the line segments, we get

Arc Length i = 1 n 1 + [ f ( x i * ) ] 2 Δ x .

This is a Riemann sum. Taking the limit as n , we have

Questions & Answers

differentiate between demand and supply giving examples
Lambiv Reply
differentiated between demand and supply using examples
Lambiv
what is labour ?
Lambiv
how will I do?
Venny Reply
how is the graph works?I don't fully understand
Rezat Reply
information
Eliyee
devaluation
Eliyee
t
WARKISA
hi guys good evening to all
Lambiv
multiple choice question
Aster Reply
appreciation
Eliyee
explain perfect market
Lindiwe Reply
In economics, a perfect market refers to a theoretical construct where all participants have perfect information, goods are homogenous, there are no barriers to entry or exit, and prices are determined solely by supply and demand. It's an idealized model used for analysis,
Ezea
What is ceteris paribus?
Shukri Reply
other things being equal
AI-Robot
When MP₁ becomes negative, TP start to decline. Extuples Suppose that the short-run production function of certain cut-flower firm is given by: Q=4KL-0.6K2 - 0.112 • Where is quantity of cut flower produced, I is labour input and K is fixed capital input (K-5). Determine the average product of lab
Kelo
Extuples Suppose that the short-run production function of certain cut-flower firm is given by: Q=4KL-0.6K2 - 0.112 • Where is quantity of cut flower produced, I is labour input and K is fixed capital input (K-5). Determine the average product of labour (APL) and marginal product of labour (MPL)
Kelo
yes,thank you
Shukri
Can I ask you other question?
Shukri
what is monopoly mean?
Habtamu Reply
What is different between quantity demand and demand?
Shukri Reply
Quantity demanded refers to the specific amount of a good or service that consumers are willing and able to purchase at a give price and within a specific time period. Demand, on the other hand, is a broader concept that encompasses the entire relationship between price and quantity demanded
Ezea
ok
Shukri
how do you save a country economic situation when it's falling apart
Lilia Reply
what is the difference between economic growth and development
Fiker Reply
Economic growth as an increase in the production and consumption of goods and services within an economy.but Economic development as a broader concept that encompasses not only economic growth but also social & human well being.
Shukri
production function means
Jabir
What do you think is more important to focus on when considering inequality ?
Abdisa Reply
any question about economics?
Awais Reply
sir...I just want to ask one question... Define the term contract curve? if you are free please help me to find this answer 🙏
Asui
it is a curve that we get after connecting the pareto optimal combinations of two consumers after their mutually beneficial trade offs
Awais
thank you so much 👍 sir
Asui
In economics, the contract curve refers to the set of points in an Edgeworth box diagram where both parties involved in a trade cannot be made better off without making one of them worse off. It represents the Pareto efficient allocations of goods between two individuals or entities, where neither p
Cornelius
In economics, the contract curve refers to the set of points in an Edgeworth box diagram where both parties involved in a trade cannot be made better off without making one of them worse off. It represents the Pareto efficient allocations of goods between two individuals or entities,
Cornelius
Suppose a consumer consuming two commodities X and Y has The following utility function u=X0.4 Y0.6. If the price of the X and Y are 2 and 3 respectively and income Constraint is birr 50. A,Calculate quantities of x and y which maximize utility. B,Calculate value of Lagrange multiplier. C,Calculate quantities of X and Y consumed with a given price. D,alculate optimum level of output .
Feyisa Reply
Answer
Feyisa
c
Jabir
the market for lemon has 10 potential consumers, each having an individual demand curve p=101-10Qi, where p is price in dollar's per cup and Qi is the number of cups demanded per week by the i th consumer.Find the market demand curve using algebra. Draw an individual demand curve and the market dema
Gsbwnw Reply
suppose the production function is given by ( L, K)=L¼K¾.assuming capital is fixed find APL and MPL. consider the following short run production function:Q=6L²-0.4L³ a) find the value of L that maximizes output b)find the value of L that maximizes marginal product
Abdureman
types of unemployment
Yomi Reply
What is the difference between perfect competition and monopolistic competition?
Mohammed
Got questions? Join the online conversation and get instant answers!
Jobilize.com Reply
Practice Key Terms 3

Get Jobilize Job Search Mobile App in your pocket Now!

Get it on Google Play Download on the App Store Now


Source:  OpenStax, Calculus volume 1. OpenStax CNX. Feb 05, 2016 Download for free at http://cnx.org/content/col11964/1.2
Google Play and the Google Play logo are trademarks of Google Inc.

Notification Switch

Would you like to follow the 'Calculus volume 1' conversation and receive update notifications?

Ask