| << Chapter < Page | Chapter >> Page > |
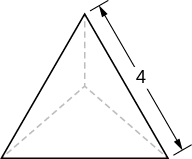
A tetrahedron with a base side of 4 units, as seen here.
units 3
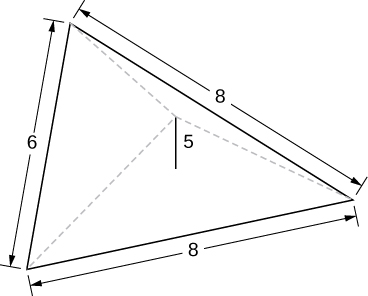
A pyramid with height 5 units, and an isosceles triangular base with lengths of 6 units and 8 units, as seen here.
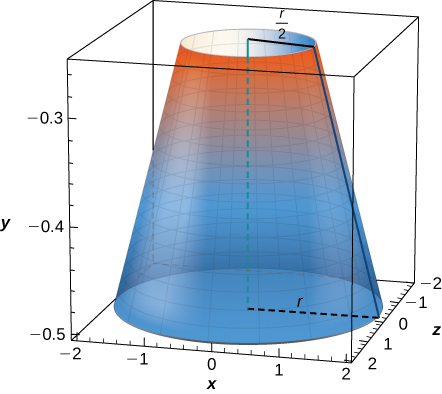
A cone of radius and height has a smaller cone of radius and height removed from the top, as seen here. The resulting solid is called a frustum .
units 3
For the following exercises, draw an outline of the solid and find the volume using the slicing method.
The base is a circle of radius The slices perpendicular to the base are squares.
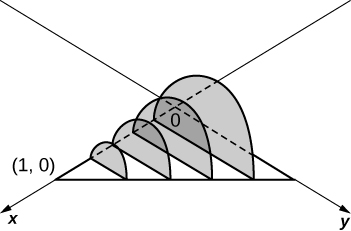
The base is a triangle with vertices and Slices perpendicular to the xy -plane are semicircles.
units
3
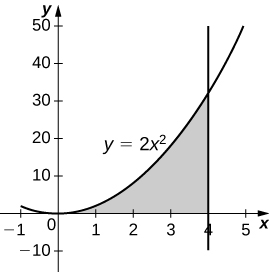
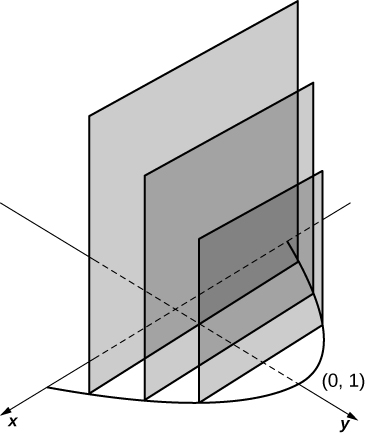
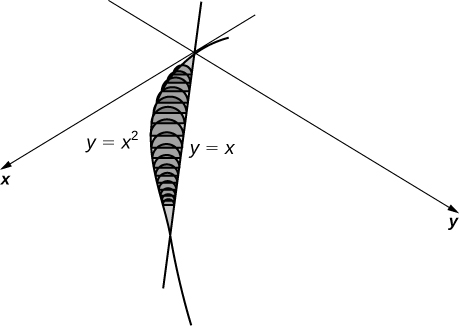
The base is the region under the parabola in the first quadrant. Slices perpendicular to the xy -plane are squares.
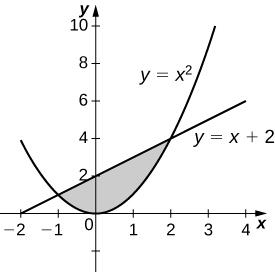
The base is the region under the parabola and above the Slices perpendicular to the are squares.
units
3
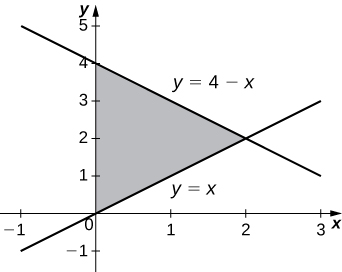
The base is the region enclosed by and Slices perpendicular to the x -axis are right isosceles triangles.
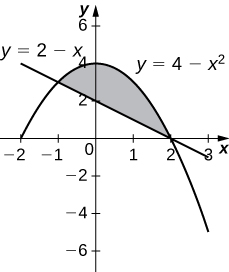
The base is the area between and Slices perpendicular to the x -axis are semicircles.
units
3
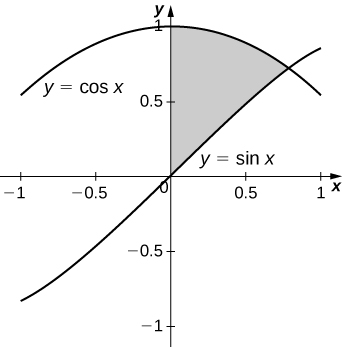
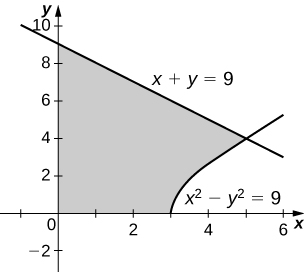
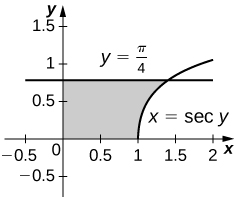
For the following exercises, draw the region bounded by the curves. Then, use the disk method to find the volume when the region is rotated around the x -axis.
For the following exercises, draw the region bounded by the curves. Then, find the volume when the region is rotated around the y -axis.
For the following exercises, draw the region bounded by the curves. Then, find the volume when the region is rotated around the x -axis.
For the following exercises, draw the region bounded by the curves. Then, use the washer method to find the volume when the region is revolved around the y -axis.
Yogurt containers can be shaped like frustums. Rotate the line around the y -axis to find the volume between
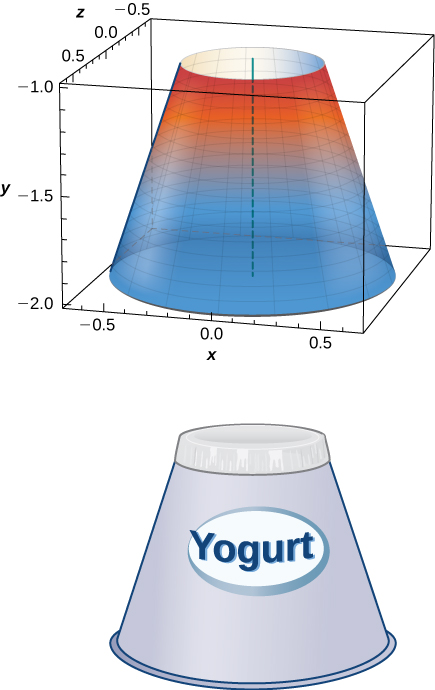
units 3
Rotate the ellipse around the x -axis to approximate the volume of a football, as seen here.
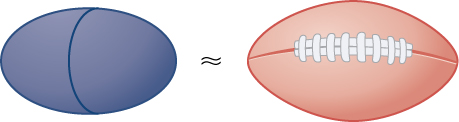
Rotate the ellipse around the y -axis to approximate the volume of a football.
units 3
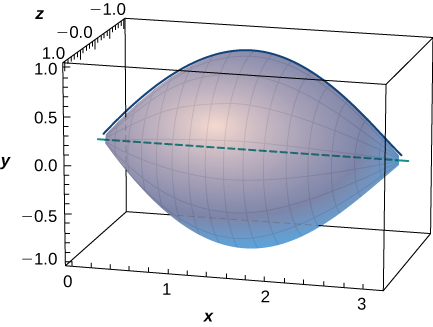
A better approximation of the volume of a football is given by the solid that comes from rotating around the x -axis from to What is the volume of this football approximation, as seen here?
What is the volume of the Bundt cake that comes from rotating around the y -axis from to
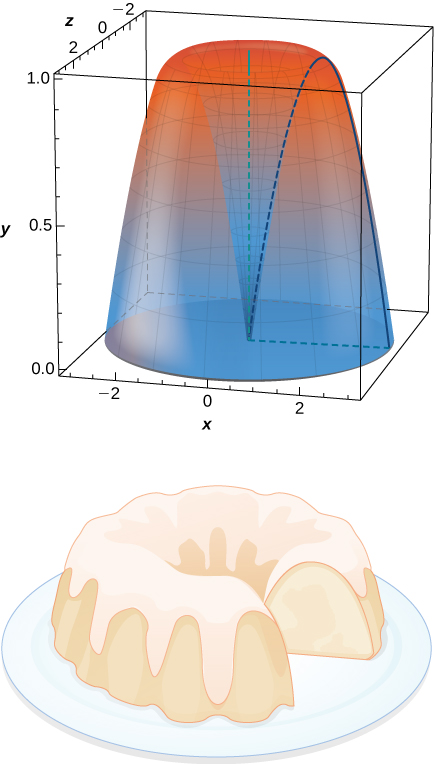
units 3
For the following exercises, find the volume of the solid described.
The base is the region between and Slices perpendicular to the x -axis are semicircles.
The base is the region enclosed by the generic ellipse Slices perpendicular to the x -axis are semicircles.
units 3
Bore a hole of radius down the axis of a right cone and through the base of radius as seen here.

Find the volume common to two spheres of radius with centers that are apart, as shown here.
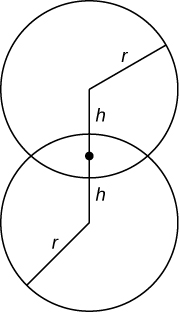
units 3
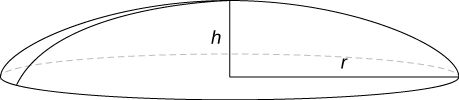
Find the volume of a spherical cap of height and radius where as seen here.
Find the volume of a sphere of radius with a cap of height removed from the top, as seen here.
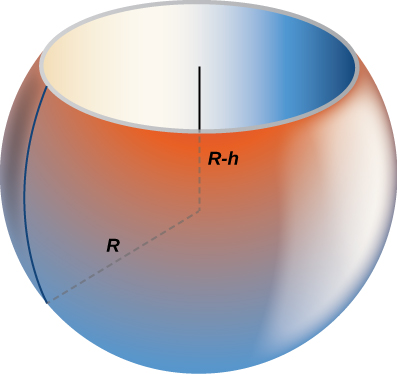
units 3
Notification Switch
Would you like to follow the 'Calculus volume 1' conversation and receive update notifications?

|
|

|
|

|
|

|
|

|
|

|
|
|
|
|

|
|

|
|
|
|